FIGURE SUMMARY
Title

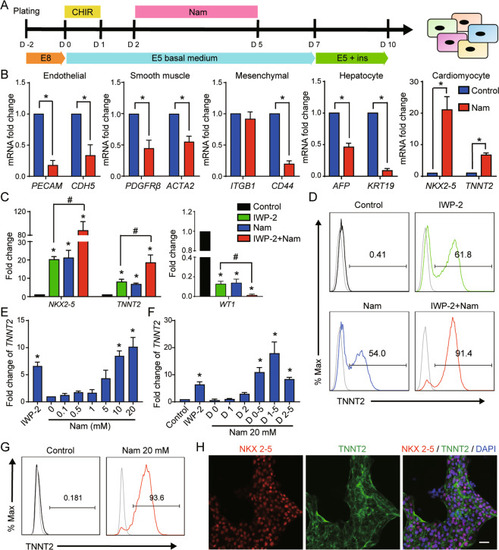
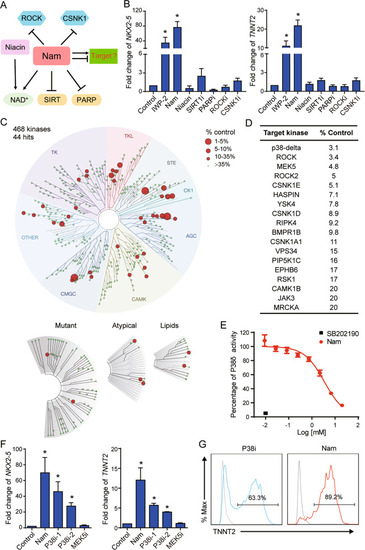
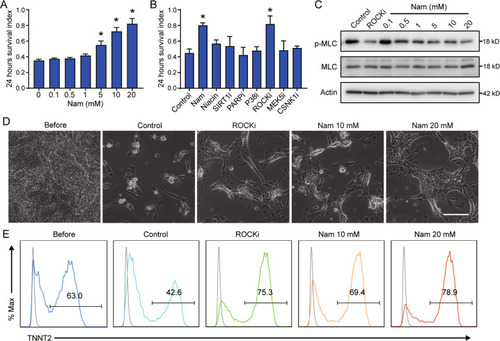
Nicotinamide promotes cardiomyocyte derivation and survival through kinase inhibition in human pluripotent stem cells

Authors
Meng, Y., Song, C., Ren, Z., Li, X., Yang, X., Ai, N., Yang, Y., Wang, D., Zhan, M., Wang, J., Lei, C.L., Liu, W., Ge, W., Lu, L., Chen, G.
Source
Full text @ Cell Death Dis.

Effect of nicotinamide on mesodermal differentiation.

A The schematic diagram showing the protocol of mesoderm differentiation with or without nicotinamide. hESCs were seeded in matrigel-coated plates for 2 days, treated with CHIR99021 (CHIR) 5 μM for 1 day, and then treated with or without nicotinamide 10 mM from day 2 to day 5. Differentiated cells were harvested for analyses at day 10. B Analyses of mRNA expression levels of PECAM, CDH5, PDGFRB, ACTA2, ITGB1, CD44, AFP, KRT19, NKX2-5, and TNNT2 in the neutral condition with or without nicotinamide treatment. Blue, control; red, nicotinamide 10 mM. C Analyses of mRNA expression levels of NKX2-5, TNNT2, and WT1 in cardiac differentiation. Black, Control; green, IWP-2 3 μM; blue, Nicotinamide 10 mM; red, IWP-2 3 μM and nicotinamide 10 mM. D The percentage of TNNT2-positive cells was determined by flow cytometry. The results shown are representative of three independent experiments. Gray line indicates the level of isotype control. E Dose-dependent effect of nicotinamide on the gene expression of TNNT2 in cardiac differentiation. Nicotinamide or IWP-2 was added from day 2 to day 5. Data shown are normalized with Nam 0 (*p < 0.05 compared with Nam 0). F Timing effect of nicotinamide on the gene expression of TNNT2 in cardiac differentiation. G After 13 days of differentiation, TNNT2-positive cells were determined by flow cytometry. Nicotinamide (Nam) at 20 mM added from day 1 to day 5. Gray line indicates the level of isotype control. The results shown are representative of 3 independent experiments. H Confocal microscopy images showing immunostaining of NKX2.5 and TNNT2 in differentiated cells treated by nicotinamide (Nam) 20 mM at day 13 of differentiation. Scale bar, 20 μm. Data shown are mean ± SD of three independent experiments (*p < 0.05 compared with control, #p < 0.05 compared with IWP-2).

Characterization of cardiomyocytes induced by nicotinamide.

A Immunostaining images of NKX2.5 and TNNT2 in differentiated cells treated by IWP-2 or nicotinamide (Nam) at day 30 of differentiation. Scale bar, 50 μm. B Representative flow cytometric analyses showing the proportion of TNNT2 at day 30 of differentiation. Gray line indicates the level of isotype control. Data are representative of three independent experiments. C Representative confocal microscopy images of α-Actinin and DAPI in the cardiomyocytes derived by IWP-2 3 μM or nicotinamide 20 mM after 25 days of differentiation. Scale bar, 10 μm. D Quantification of sarcomere length using LAS X software. (Data shown are mean ± SD, n = 38−40 cells, *p < 0.05 compared with IWP-2 group). E Heatmap showing the gene expression profiles of cardiomyocytes induced by IWP-2 or nicotinamide (Nam) at day 25. The differentiated cells were harvested at day 25, and the relative expression level of genes was analyzed by qPCR. Results shown are average of three independent experiments, and represent log10 of gene expression levels relative to TBP. F Representative recordings of active potential in nicotinamide or IWP-2-derived cardiomyocytes. G Action potential (AP) duration 50%, 90% (APD50, APD90), and frequency were analyzed. (Data shown are mean ± SD, n = 24−26 cells, *p < 0.05 compared with IWP-2 group). H Oxygen consumption rate (OCR) of IWP-2 or nicotinamide-induced cardiomyocytes was measured using Mito Stress Test. I Basal respiration, maximal respiration, ATP production, and spare respiratory capacity of cardiomyocytes were calculated. (Data shown are mean ± SD, n = 3−4, *p < 0.05 compared with IWP-2 group).

Nicotinamide directs cardiomyocyte cell fate through the inhibition of P38δ.

A The diagram showing the molecules related to nicotinamide. Nicotinamide (Nam) and niacin can be transformed to NAD+ by different enzymes. Nicotinamide blocks the activation of these NAD+ consuming enzymes such as SIRT and PARP, and it also inhibits the activity of ROCK and CSNK1. B Analyses of mRNA expression levels of NKX2-5 and TNNT2 at day 10 of differentiation with the indicated treatments. hESC H1 cells were treated with IWP-2 3 μM from day 2 to day 5, Nicotinamide (Nam) 20 mM, Niacin 10 mM, EX527 (SIRT1i) 10 μM, AZD2281 (PARPi) 100 nM, Y-27632 (ROCKi) 10 μM or D4476 (CSNK1i) 10 μM from day 1 to day 5. C TREEspotTM interaction maps of nicotinamide. % Control indicates the binding efficiency between the substrate and specific kinase, and lower numbers indicate stronger inhibition. Kinase hits (% Control < 35) are labeled with red circles, and larger circles indicate the kinases with lower % Control. D The target kinases with % Control < 20 under 3 mM nicotinamide treatment from the DiscoverX KINOMEscan service. Lower numbers of % Control indicates higher-affinity binding. E The influence of nicotinamide on P38δ activity in vitro measured by the bioluminescent kinase assay (n = 3 technical replicates). The red circle indicates different doses of nicotinamide (Nam), and the black square indicates SB202190 (P38i) 10 μM. The data shown are representative of three independent experiments. F Analyses of mRNA expression levels of NKX2-5 and TNNT2 on day 10 of differentiation treated with Nicotinamide (Nam) 20 mM, SB202190 (P38i-1) 10 μM, SB203580 (P38i-2) 10 μM, or BIX02189 (MEK5i) 5 μM from day 1 to day 5. G Representative flow cytometric analyses showing the percentage of TNNT2-positive cells after 13 days of differentiation induced by SB202190 (P38i) or nicotinamide (Nam). Results are representative of three independent experiments. Data shown are normalized to control, and presented as mean ± SD of three independent experiments (*p < 0.05 compared with Control).

Nicotinamide-induced cardiac differentiation is independent of canonical WNT inhibition.

A Analyses of gene expression of WNTs after 5 days of differentiation by qPCR. B Gene expressions of the downstream targets of canonical WNT (AXIN2) and noncanonical WNT (ALCAM) after 5 days of differentiation. C Gene expression of WNT receptors after 5 days of differentiation. D Confocal microscopy images showing the immunostaining images of β-Catenin in differentiated cells treated with IWP-2, nicotinamide (Nam), or P38 inhibitor (P38i). After plating for 2 days, hESCs were treated with CHIR99021 5 μM for 1 day, and then IWP-2 (3 μM), nicotinamide (20 mM) or P38 inhibitor SB202190 (10 μM) for 1 day to examine their impact on β-Catenin expression. Scale bar, 50 μm. Data shown are normalized to control, and represent mean ± SD of three independent experiments (*p < 0.05 compared with Control).

Comparison of gene expression in cardiomyocytes induced by WNT inhibitor, P38 inhibitor, and nicotinamide.

A Hierarchical clustering analyses of differentiated cells with the indicated treatments. IWP-2 at 3 μM was added from day 2 to day5, and nicotinamide (Nam) at 20 mM or P38 inhibitor SB202190 (P38i) 10 μM were added from day 1 to day 5. The samples were harvested for microarray after 10 days of differentiation. B Enrichr analysis results showing the top 10 cell types enriched by nicotinamide, P38 inhibitor, or IWP-2 based on gene expression profiles. Venn diagram showing the numbers of genes upregulated (C) and downregulated (D) by nicotinamide (Nam), SB202190, or IWP-2 compared with untreated control. E The top 10 pathways enriched by the 446 genes upregulated by nicotinamide (Nam) and P38 inhibitor (P38i), but not IWP-2. F The top 10 pathways enriched by the 801 genes downregulated by nicotinamide (Nam), or P38 inhibitor (P38i), but not IWP-2. Comparison of gene expression related to heart development (G) and cell cycle (H) in the differentiated cells generated under different treatments after 10 days of differentiation.

Nicotinamide promotes the survival of hESC-derived cardiomyocytes and improves cardiomyocyte purity.

A Dose-dependent impact of nicotinamide on the survival of hESC-derived cardiomyocytes. After 10 days of differentiation, hESC-derived cardiomyocytes were passaged under the indicated doses of nicotinamide (Nam). The survival index indicates the number of living cells divided by the input cells after 24 h of plating. B The effect of different modulators related to nicotinamide on cardiomyocyte survival 24 h after dissociation. Nicotinamide (Nam) 20 mM, Niacin 20 mM, EX527 (SIRT1i) 10 μM, AZD2281 (PARPi) 100 nM, SB202190 (P38i) 10 μM, Y-27632 (ROCKi) 10 μM, BIX02189 (MEK5i) 5 μM or D4476 (CSNK1i) 10 μM. C Phosphorylation of MLC (Ser19) in dissociated cardiomyocytes under indicated doses of nicotinamide or ROCK inhibitor (Y27632, 10 μM) treatment for 1 h after individualization. D Representative phase-contrast images of cardiomyocytes passaged under the indicated treatments, 24 h after plating. Nicotinamide (Nam) 10 mM or 20 mM, Y27632 (ROCKi) 10 μM. Scale bar, 100 μm. E Flow cytometric analyses showing the percentage of TNNT2-positive cardiomyocytes passaged under the indicated treatments, 24 h after plating. Data shown are normalized to control, and represent mean ± SD of three independent experiments (*p < 0.05 compared with Control).

The influence of nicotinamide in zebrafish cardiovascular system development.

A Effect of nicotinamide on the development of The Tg(Fli1:EGFP) transgenic zebrafish. Nicotinamide was applied between 18 and 24 h post fertilization. The images were taken after 3 days of treatment. Top, the bright field images of zebrafishes; Bottom, the fluorescence images. Scale bar, 200 μm. B The enlarged images showing the intersegmental vessels (ISV) and subintestinal veins (SIV) of zebrafishes. Scale bar, 100 μm. C Percentage of zebrafish with pericardial edema, impaired ISV, or impaired SIV (n = 22 in control group, and n = 26 in nicotinamide group). D The schematic diagram showing the protocol of endothelial and smooth muscle differentiation. VEGF 50 ng/mL was added from day 2 to day 5 in the absence or presence of 10 mM nicotinamide. E Analyses of mRNA expression levels of PECAM, CDH5, PDGFRβ, and ACTA2 by qPCR at day 9 of differentiation. Black, Control; green, VEGF 50 ng/mL; blue, Nicotinamide 10 mM; red, VEGF 50 ng/mL and nicotinamide 10 mM. Data shown are normalized to control and represent three independent experiments (*p < 0.05 compared with control, #p < 0.05 compared with VEGF). F The indicated inhibitors were added to analyze the mechanism of nicotinamide in VEGF-induced differentiation. The mRNA levels of PDGFRβ and ACTA2 were measured by q-PCR at day 9 of differentiation. The following treatments were added from day 2 to day 5 together with VEGF (50 ng/mL): Nicotinamide (Nam,10 mM), P38 inhibitor SB202190 (P38i, 10 μM), ROCK inhibitor Y-27632 (ROCKi, 10 μM), CSNK1 inhibitor D4476 (CSNK1i, 10 μM), MEK5 inhibitor BIX02189 (MEK5i, 5 μM), PARP inhibitor AZD2281 (PARPi, 100 nM), SIRT1 inhibitor EX527 (SIRT1i, 10 μM), or Niacin (10 mM). Data shown are normalized to control and represent mean ± SD of three independent experiments (#p < 0.05 compared with VEGF).

Acknowledgments
This image is the copyrighted work of the attributed author or publisher, and ZFIN has permission only to display this image to its users. Additional permissions should be obtained from the applicable author or publisher of the image. Full text @ Cell Death Dis.