|
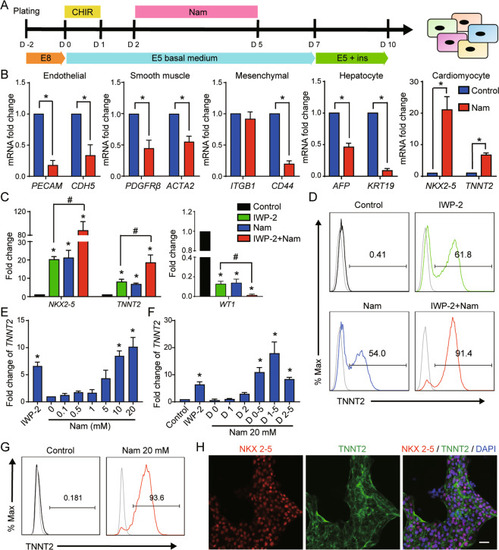
Effect of nicotinamide on mesodermal differentiation.A The schematic diagram showing the protocol of mesoderm differentiation with or without nicotinamide. hESCs were seeded in matrigel-coated plates for 2 days, treated with CHIR99021 (CHIR) 5 μM for 1 day, and then treated with or without nicotinamide 10 mM from day 2 to day 5. Differentiated cells were harvested for analyses at day 10. B Analyses of mRNA expression levels of PECAM, CDH5, PDGFRB, ACTA2, ITGB1, CD44, AFP, KRT19, NKX2-5, and TNNT2 in the neutral condition with or without nicotinamide treatment. Blue, control; red, nicotinamide 10 mM. C Analyses of mRNA expression levels of NKX2-5, TNNT2, and WT1 in cardiac differentiation. Black, Control; green, IWP-2 3 μM; blue, Nicotinamide 10 mM; red, IWP-2 3 μM and nicotinamide 10 mM. D The percentage of TNNT2-positive cells was determined by flow cytometry. The results shown are representative of three independent experiments. Gray line indicates the level of isotype control. E Dose-dependent effect of nicotinamide on the gene expression of TNNT2 in cardiac differentiation. Nicotinamide or IWP-2 was added from day 2 to day 5. Data shown are normalized with Nam 0 (*p < 0.05 compared with Nam 0). F Timing effect of nicotinamide on the gene expression of TNNT2 in cardiac differentiation. G After 13 days of differentiation, TNNT2-positive cells were determined by flow cytometry. Nicotinamide (Nam) at 20 mM added from day 1 to day 5. Gray line indicates the level of isotype control. The results shown are representative of 3 independent experiments. H Confocal microscopy images showing immunostaining of NKX2.5 and TNNT2 in differentiated cells treated by nicotinamide (Nam) 20 mM at day 13 of differentiation. Scale bar, 20 μm. Data shown are mean ± SD of three independent experiments (*p < 0.05 compared with control, #p < 0.05 compared with IWP-2).
|