IMAGE

Fig. 5

ID
ZDB-IMAGE-220327-17
Source
Figures for Meng et al., 2021
Image
Figure Caption

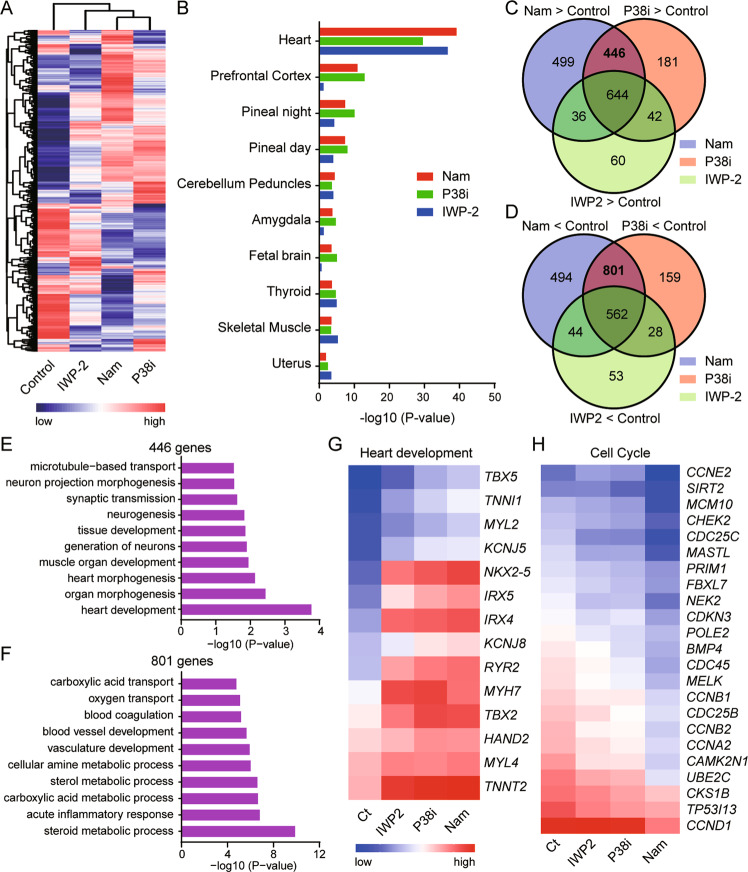
Fig. 5 Comparison of gene expression in cardiomyocytes induced by WNT inhibitor, P38 inhibitor, and nicotinamide.

A Hierarchical clustering analyses of differentiated cells with the indicated treatments. IWP-2 at 3 μM was added from day 2 to day5, and nicotinamide (Nam) at 20 mM or P38 inhibitor SB202190 (P38i) 10 μM were added from day 1 to day 5. The samples were harvested for microarray after 10 days of differentiation. B Enrichr analysis results showing the top 10 cell types enriched by nicotinamide, P38 inhibitor, or IWP-2 based on gene expression profiles. Venn diagram showing the numbers of genes upregulated (C) and downregulated (D) by nicotinamide (Nam), SB202190, or IWP-2 compared with untreated control. E The top 10 pathways enriched by the 446 genes upregulated by nicotinamide (Nam) and P38 inhibitor (P38i), but not IWP-2. F The top 10 pathways enriched by the 801 genes downregulated by nicotinamide (Nam), or P38 inhibitor (P38i), but not IWP-2. Comparison of gene expression related to heart development (G) and cell cycle (H) in the differentiated cells generated under different treatments after 10 days of differentiation.

Acknowledgments
This image is the copyrighted work of the attributed author or publisher, and ZFIN has permission only to display this image to its users. Additional permissions should be obtained from the applicable author or publisher of the image. Full text @ Cell Death Dis.