FIGURE SUMMARY
Title

Svep1 stabilizes developmental vascular anastomosis in reduced flow conditions

Authors
Coxam, B., Collins, R.T., Hußmann, M., Huisman, Y., Meier, K., Jung, S., Bartels-Klein, E., Szymborska, A., Finotto, L., Helker, C.S.M., Stainier, D.Y.R., Schulte-Merker, S., Gerhardt, H.
Source
Full text @ Development

svep1 mutant and morphant zebrafish embryos exhibit vascular anastomosis defects. (A) Stills from time-lapse movie of Tg(-0.8flt1:RFP)hu3333; TgBAC(flt4:Citrine) embryos injected with MO-CTL (5 ng) or MO-svep1 (5 ng) and treated with 1× (0.014%) tricaine from 30 to 48 hpf. White asterisks indicate gaps in the DLAV. (B) Still from a time-lapse movie of a Tg(-0.8flt1:RFP)hu3333; TgBAC(flt4:Citrine) embryo injected with MO-CTL (5 ng) exhibiting a gap in the DLAV between two adjacent ISVs. Side view, dorsal side left. (C) Bilateral quantifications of the percentage of gaps in the DLAV at 48 hpf in WT (n=5), svep1hu4767 heterozygous (n=18) and svep1hu4767 homozygous embryos (n=10) treated with 1× tricaine (0.014%) from 30 to 48 hpf (N=3). (D) Bilateral quantifications of the percentage of lumenised segments in the DLAV at 48 hpf in WT (n=5), svep1hu4767 heterozygous (n=18) and svep1hu4767 homozygous embryos (n=10) treated with 1× tricaine (0.014%) from 30 to 48 hpf (N=3). (E) Bilateral quantifications of the percentage of gaps in the DLAV at 48 hpf in embryos injected with MO-CTL (5 ng) (n=20) and MO-svep1 (5 ng) (n=36) and treated with 1× tricaine (0.014%) from 30 to 48 hpf (N=6). (F) Bilateral quantifications of the percentage of lumenised segments in the DLAV at 48 hpf in embryos injected with MO-CTL (5 ng) (n=20) and MO-svep1 (5 ng) (n=36) and treated with 1× tricaine (0.014%) from 30 to 48 hpf (N=6). Data are mean±s.d. Mann–Whitney test. Scale bars: 50 μm (A); 10 μm (B).

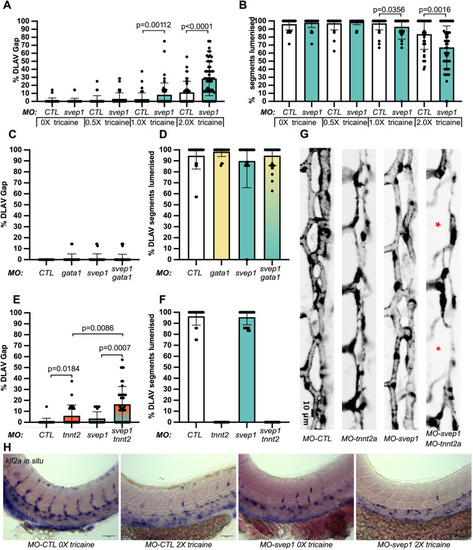
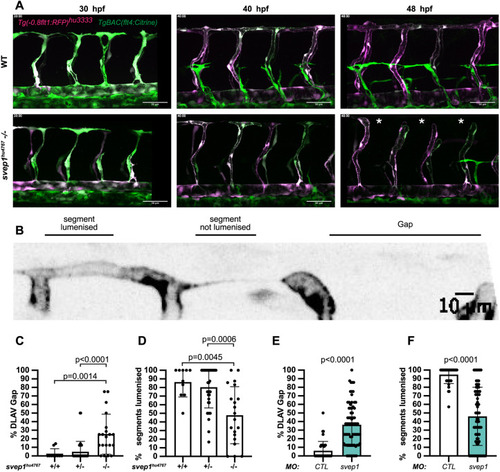
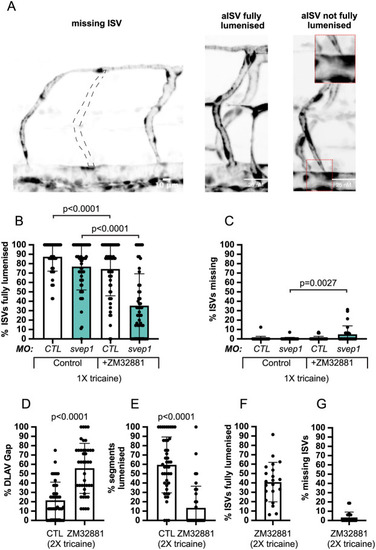
svep1 loss-of-function sensitises angiogenic remodelling to reduced blood flow. (A) Bilateral quantifications of the percentage of gaps in the DLAV at 48 hpf in embryos injected with MO-CTL (5 ng) and MO-svep1 (5 ng) and treated with 0× (n=14 MO-CTL, n=20 MO-svep1), 0.5× (n=16 MO-CTL, n=24 MO-svep1), 1× (n=22 MO-CTL, n=27 MO-svep1) or 2× (n=21 MO-CTL, n=27 MO-svep1) from 30 to 48 hpf (N=3). (B) Bilateral quantifications of the percentage of lumenised segments in the DLAV at 48 hpf in embryos injected with MO-CTL (5 ng) and MO-svep1 (5 ng) and treated with 0× (n=14 MO-CTL, n=20 MO-svep1), 0.5× (n=16 MO-CTL, n=24 MO-svep1), 1× (n=22 MO-CTL, n=27 MO-svep1) or 2× (n=21 MO-CTL, n=27 MO-svep1) from 30 to 48 hpf (N=3). (C) Bilateral quantifications of the percentage of gaps in the DLAV at 48 hpf in embryos injected with MO-CTL (5 ng) (n=13), MO-gata1 (8 ng) (n=12), MO-svep1 (5 ng) (n=16) and MO-gata1 (8 ng)/MO-svep1 (5 ng) (n=25) (N=3). (D) Bilateral quantifications of the percentage of lumenised segments in the DLAV at 48 hpf in embryos injected with MO-CTL (5 ng) (n=13), MO-gata1 (8 ng) (n=12), MO-svep1 (5 ng) (n=16) and MO-gata1 (8 ng)/MO-svep1 (5 ng) (n=25) (N=3). (E) Bilateral quantifications of the percentage of gaps in the DLAV at 48 hpf in embryos injected with MO-CTL (5 ng) (n=11), MO-tnnt2a (4 ng) (n=12), MO-svep1 (5 ng) (n=12) and MO-tnnt2a (4 ng)/MO-svep1 (5 ng) (n=21) (N=3). (F) Bilateral quantifications of the percentage of lumenised segments in the DLAV at 48 hpf in embryos injected with MO-CTL (5 ng) (n=11), MO-tnnt2a (8 ng) (n=12), MO-svep1 (5 ng) (n=12) and MO-tnnt2a (4 ng)/MO-svep1 (5 ng) (n=21) (N=3). (G) Maximum intensity projection of dorsal view of the DLAV from representative embryos injected with MO-CTL (5 ng) (n=11), MO-tnnt2a (8 ng) (n=12), MO-svep1 (5 ng) (n=12) and MO-tnnt2a (4 ng)/MO-svep1 (5 ng) (n=21) embryos at 48 hpf. Red asterisks indicate gaps. (H) Bright-field images of klf2a in situ hybridisation of 48 hpf embryos injected with MO-CTL or MO-svep1 and treated with 0× or 2× tricaine from 30 to 48 hpf. Data are mean±s.d. Mann–Whitney test. Scale bars: 10 μm (G); 50 μm (H).

svep1 is expressed in neurons in the neural tube. (A) Representative images of 48 hpf Tg(svep1:Gal4FF; UAS:eGFP); Tg(kdrl:mcherry-CAAX)y171 embryos with or without treatment with 1× (0.0168%) tricaine from 30 to 48 hpf. (B) Quantification of average numbers of Tg(svep1:Gal4FF; UAS:eGFP)-positive neurons in the neural tube area of 48 hpf embryos with or without treatment with 1× (0.0168%) tricaine from 30 to 48 hpf (N=3, n=15 controls, n=16 treated). (C) Bilateral quantifications of the percentage of gaps in the DLAV at 48 hpf in embryos injected with control mRNA (GFP, 50 pg) or alpha-bungarotoxin (αBung) mRNA, MO-CTL (5 ng) or MO-svep1 (5 ng), and treated with 0× or 2× tricaine from 30-48 hpf. (N=2, n=24-28). (D) Bilateral quantifications of the percentage of lumenised segments in the DLAV at 48 hpf in embryos injected with control mRNA (GFP, 50 pg) or αBung mRNA, MO-CTL (5 ng) or MO-svep1 (5 ng) and treated with 0× or 2× tricaine from 30 to 48 hpf (N=2, n=24-28). Data are mean±s.d. Mann–Whitney test. Scale bars: 50 μm (A).

svep1 loss-of-function leads to a defect in tip/stalk cell specification in primary angiogenic sprouts. (A) Maximum intensity projection of a representative TgBAC(apln:eGFP)bns157, Tg(-0.8flt1:RFP)hu5333 MO-CTL (5 ng) embryo. A′ shows the unprocessed maximum intensity projection, A″ shows the GFP signal volume-masked by the RFP signal, to limit detection to the endothelium and A‴ shows the resulting endothelial GFP signal only. Panel on right is magnification of boxed area in A″. (B) Maximum intensity projection of a representative TgBAC(apln:eGFP)bns157, Tg(-0.8flt1:RFP)hu5333MO-CTL (5 ng) embryo. B′ shows the unprocessed maximum intensity projection, B″ shows the GFP signal volume-masked by the RFP signal, to limit detection to the endothelium and B‴ shows the resulting endothelial GFP signal only. Panel on right is magnification of boxed area in B″. White arrowheads indicate apln:eGFP expression in ISVs in A and B. (C) Maximum intensity projection of a MO-CTL (5 ng) aISV at 48 hpf, highlighting the ventral and dorsal region used for further quantifications in D and E. (D) Quantification of the percentage of aISVs with apln:eGFP-positive endothelial cells in the dorsal and ventral regions in 48 hpf MO-CTL (5 ng) (n=10) and MO-svep1(5 ng) (n=16) morphant embryos treated with 1× (0.014%) tricaine from 30 to 48 hpf (N=3). (E) Quantification of the percentage of aISVs with more than one apln:eGFP-positive endothelial cell in 48 hpf MO-CTL (5 ng) (n=10) and MO-svep1 (5 ng) (n=16) morphant embryos treated with 1× (0.014%) tricaine from 30 to 48 hpf (N=3). (F) Representative image of p-ERK and ERK levels in FACS sorted endothelial cells from MO-CTL (5 ng) and MO-svep1 (5 ng) morphants at 48 hpf treated with 1× (0.014%) tricaine from 30 to 48 hpf (N=4). (G) Quantification of p-ERK in FACS sorted endothelial cells of MO-CTL (5 ng) and MO-svep1 (5 ng) morphants at 48 hpf, treated with 1× (0.014%) tricaine from 30 to 48 hpf. Expression levels were normalised to total ERK levels (N=4). (H) Quantification of the percentage of aISVs with apln:eGFP-positive endothelial cells in the dorsal and ventral regions in 48 hpf embryos treated with 1× (0.014%) (n=22) or 2× (0.028%) (n=24) tricaine from 30 to 48 hpf (N=3). (I) Quantification of the percentage of aISVs with more than one apln:eGFP-positive endothelial cell in 48 hpf embryos treated with 1× (0.014%) (n=22) or 2× (0.028%) (n=24) tricaine from 30 to 48 hpf (N=3). Data are mean±s.d. Mann–Whitney test. Scale bars: 50 μm (A′-A‴,B′-B‴); 10 μm (A,B, magnification, C).

svep1 loss-of-function and knockdown are rescued by flt1 knockdown. (A) Bilateral quantifications of the percentage of gaps in the DLAV at 48 hpf in controls and svep1hu4767−/− embryos injected with MO-CTL (5 ng) (n=45 and n=27, respectively) or MO-flt1 (1 ng) (n=50 and n=12, respectively), and treated with 1× tricaine from 30 to 48 hpf (N=3). (B) Bilateral quantifications of the percentage of gaps in the DLAV at 48 hpf in MO-CTL (5 ng) (n=9), MO-flt1 (1 ng) (n=7), MO-svep1 (5 ng) (n=14) embryos (N=3), and treated with 1× tricaine from 30 to 48 hpf. (C) Bilateral quantifications of the percentage of lumenised segments in the DLAV at 48 hpf in controls and mutant svep1512−/− injected with MO-CTL (5 ng) (n=45 and n=27, respectively) or MO-flt1 (1 ng) (n=50 and n=12, respectively) and treated with 1× tricaine from 30 to 48 hpf (N=3). (D) Bilateral quantifications of the percentage of lumenised segments in the DLAV at 48 hpf in MO-CTL (5 ng) (n=9), MO-flt1 (1 ng) (n=7), MO-svep1 (5 ng) (n=14) and MO-flt1 (1 ng)/MO-svep1 (5 ng) (n=25) embryos (N=3). (E) Bilateral quantifications of the percentage of aISV loops at 48 hpf in MO-CTL (5 ng) (n=11), MO-flt1 (1 ng) (n=14), MO-svep1 (5 ng) (n=11) and MO-flt1 (1 ng)/MO-svep1 (5 ng) (n=20) embryos (N=3). (F) Representative image of an arterial aISV loop in MO-svep1 (5 ng)/MO-flt1 (1 ng) Tg(-0.8flt1:RFP)hu3333 embryos at 48 hpf, treated with 1× (0.014%) tricaine from 30 to 48 hpf. (G) Quantification of number of nuclei per loop area (see Fig. 4F) at 48 hpf in MO-svep1 (5 ng)/MO-flt1 (1 ng) embryos at 48 hpf, treated with 1× (0.014%) tricaine from 30 to 48 hpf (n=34 loops counted: 2, 19, 9 and 4 loops had 1, 2, 3 or 4 nuclei per loop area, respectively; 20/34 loops were lumenised) (N=3). (H) Representative image of an aISV-to-aISV connection in the region of the horizontal myoseptum at 48 hpf in in MO-svep1 (5 ng)/MO-flt1 (1 ng) Tg(-0.8flt1:RFP)hu3333 embryos at 48 hpf, treated with 1× (0.014%) tricaine from 30 to 48 hpf (n=20 fish, 26 connections visible out of 280 somites, 8/26 connections were lumenised) (N=3). (I) Maximum intensity projection of a representative TgBAC(apln:eGFP)bns157, Tg(-0.8flt1:RFP)hu5333 morphant embryo at 48 hpf. The panels show the GFP signal volume masked by the RFP signal to limit detection to the endothelium in MO-CTL (5 ng), MO-flt1 (1 ng), MO-svep1 (5 ng) and MO-svep1 (5 ng)/MO-flt1 (1 ng) embryos treated with 1× (0.014%) tricaine from 30 to 48 hpf. (J) Maximum intensity projection of a MO-svep1 (5 ng)/MO-flt1 (1 ng) aISV at 48 hpf, highlighting the ventral and dorsal region used for further quantifications in K. (K) Quantification of the percentage of aISVs with apln:eGFP-positive endothelial cells in the dorsal and ventral regions in 48 hpf MO-CTL (5 ng) (n=12), MO-flt1 (1 ng) (n=14), MO-svep1 (5 ng) (n=12) and MO-svep1(5 ng)/MO-flt1 (1 ng) (n=20) morphant embryos treated with 1× (0.014%) tricaine from 30 to 48 hpf (N=3). (L) Quantification of the percentage of aISVs with more than one apln:eGFP-positive endothelial cell in 48 hpf MO-CTL (5 ng) (n=12), MO-flt1 (1 ng) (n=14), MO-svep1 (5 ng) (n=12) and MO-svep1 (5 ng)/MO-flt1 (1 ng) (n=20) morphant embryos treated with 1× (0.014%) tricaine from 30 to 48 hpf (N=3). Data are mean±s.d. Mann–Whitney test. Scale bars: 10 μm (H); 100 μm (I).

Vegfa/Vegfr signalling is necessary for ISV lumenisation maintenance and DLAV formation. (A) Maximum intensity projections at 48 hpf of the trunk of MO-CTL (5 ng) and MO-svep1 (5 ng), Tg(fli1a:eGFP)y7 embryos treated with 1× (0.014%) tricaine, with or without 50 ng ZM32881. Red asterisks indicate gaps in the DLAV. (B) Bilateral quantifications of the percentage of gaps in the DLAV at 48 hpf in MO-CTL (5 ng) [n=29 (0 nM ZM32881), n=28 (50 nM ZM32881)], MO-svep1 (5 ng) [n=29 (0 nM ZM32881), n=26 (50 nM ZM32881)] embryos treated with 1× (0.014%) tricaine and 0 nM or 50 nM ZM32881 from 30 to 48 hpf (N=3). (C) Bilateral quantifications of the percentage of lumenised segments in the DLAV at 48 hpf in MO-CTL (5 ng) [n=29 (0 nM ZM32881), n=28 (50 nM ZM32881)], MO-svep1 (5 ng) [n=29 (0 nM ZM32881), n=26 (50 nM ZM32881)] embryos treated with 1× (0.014%) tricaine and 0 nM or 50 nM ZM32881 from 30 to 48 hpf (N=3). Data are mean±s.d. Mann–Whitney test. n.s., not significant. Scale bars: 50 μm (A).

Vegfa/Vegfr signalling is necessary for ISV lumenisation maintenance and DLAV formation. (A) Representative images of missing ISV, fully lumenised ISV and not fully lumenised ISV at 48 hpf. Quantifications of these phenotypes are presented in B and C. Dashed line indicates expected location of missing ISV. Inset on right is magnification of boxed area. (B) Bilateral quantifications of the percentage of missing ISVs in the trunk of 48 hpf MO-CTL (5 ng) [n=29 (0 nM ZM32881), n=28 (50 nM ZM32881)], MO-svep1 (5 ng) [n=29 (0 nM ZM32881), n=26 (50 nM ZM32881)] embryos treated with 1× (0.014%) tricaine and 0 nM or 50 nM ZM32881 from 30 to 48 hpf (N=3). (C) Bilateral quantifications of the percentage of ISVs lumenised dorsally to ventrally in the trunk of 48 hpf MO-CTL (5 ng) [n=29 (0 nM ZM32881), n=28 (50 nM ZM32881)], MO-svep1 (5 ng) [n=29 (0 nM ZM32881), n=26 (50 nM ZM32881)] embryos treated with 1× (0.014%) tricaine and 0 or 50 nM ZM32881 from 30 to 48 hpf (N=3). (D) Bilateral quantifications of the percentage of gaps in the DLAV at 48 hpf in embryos treated with 2× (0.028%) tricaine and 0 (n=22) or 50 nM (n=21) ZM32881 from 30 to 48 hpf (N=3). (E) Bilateral quantifications of the percentage of lumenised segments in the DLAV at 48 hpf in embryos treated with 2× (0.028%) tricaine and 0 nM (n=22) or 50 nM (n=21) ZM32881 from 30 to 48 hpf (N=3). (F) Bilateral quantifications of the percentage of ISVs lumenised dorsally to ventrally in the trunk of 48 hpf in embryos treated with 2× (0.028%) tricaine and 50 nM (n=21) ZM32881 from 30 to 48 hpf (N=3). (G) Bilateral quantifications of the percentage of missing ISVs in the trunk of 48 hpf in embryos treated with 2× (0.028%) tricaine and 50 nM (n=21) ZM32881 from 30 to 48 hpf (N=3). Data are mean±s.d. Mann–Whitney test.

Acknowledgments
This image is the copyrighted work of the attributed author or publisher, and ZFIN has permission only to display this image to its users. Additional permissions should be obtained from the applicable author or publisher of the image. Full text @ Development