IMAGE

Fig. 4.

ID
ZDB-IMAGE-220414-28
Source
Figures for Coxam et al., 2022
Image
Figure Caption

Fig. 4.

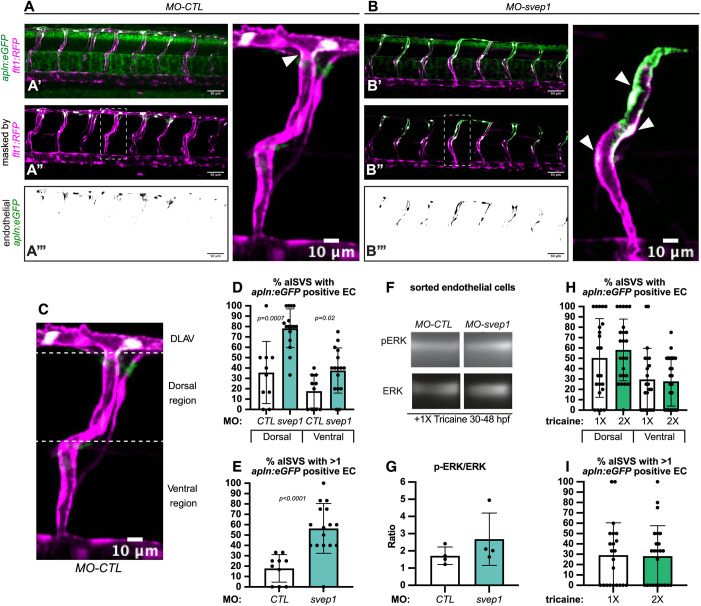
svep1 loss-of-function leads to a defect in tip/stalk cell specification in primary angiogenic sprouts. (A) Maximum intensity projection of a representative TgBAC(apln:eGFP)bns157, Tg(-0.8flt1:RFP)hu5333 MO-CTL (5 ng) embryo. A′ shows the unprocessed maximum intensity projection, A″ shows the GFP signal volume-masked by the RFP signal, to limit detection to the endothelium and A‴ shows the resulting endothelial GFP signal only. Panel on right is magnification of boxed area in A″. (B) Maximum intensity projection of a representative TgBAC(apln:eGFP)bns157, Tg(-0.8flt1:RFP)hu5333MO-CTL (5 ng) embryo. B′ shows the unprocessed maximum intensity projection, B″ shows the GFP signal volume-masked by the RFP signal, to limit detection to the endothelium and B‴ shows the resulting endothelial GFP signal only. Panel on right is magnification of boxed area in B″. White arrowheads indicate apln:eGFP expression in ISVs in A and B. (C) Maximum intensity projection of a MO-CTL (5 ng) aISV at 48 hpf, highlighting the ventral and dorsal region used for further quantifications in D and E. (D) Quantification of the percentage of aISVs with apln:eGFP-positive endothelial cells in the dorsal and ventral regions in 48 hpf MO-CTL (5 ng) (n=10) and MO-svep1(5 ng) (n=16) morphant embryos treated with 1× (0.014%) tricaine from 30 to 48 hpf (N=3). (E) Quantification of the percentage of aISVs with more than one apln:eGFP-positive endothelial cell in 48 hpf MO-CTL (5 ng) (n=10) and MO-svep1 (5 ng) (n=16) morphant embryos treated with 1× (0.014%) tricaine from 30 to 48 hpf (N=3). (F) Representative image of p-ERK and ERK levels in FACS sorted endothelial cells from MO-CTL (5 ng) and MO-svep1 (5 ng) morphants at 48 hpf treated with 1× (0.014%) tricaine from 30 to 48 hpf (N=4). (G) Quantification of p-ERK in FACS sorted endothelial cells of MO-CTL (5 ng) and MO-svep1 (5 ng) morphants at 48 hpf, treated with 1× (0.014%) tricaine from 30 to 48 hpf. Expression levels were normalised to total ERK levels (N=4). (H) Quantification of the percentage of aISVs with apln:eGFP-positive endothelial cells in the dorsal and ventral regions in 48 hpf embryos treated with 1× (0.014%) (n=22) or 2× (0.028%) (n=24) tricaine from 30 to 48 hpf (N=3). (I) Quantification of the percentage of aISVs with more than one apln:eGFP-positive endothelial cell in 48 hpf embryos treated with 1× (0.014%) (n=22) or 2× (0.028%) (n=24) tricaine from 30 to 48 hpf (N=3). Data are mean±s.d. Mann–Whitney test. Scale bars: 50 μm (A′-A‴,B′-B‴); 10 μm (A,B, magnification, C).

Acknowledgments
This image is the copyrighted work of the attributed author or publisher, and ZFIN has permission only to display this image to its users. Additional permissions should be obtained from the applicable author or publisher of the image. Full text @ Development