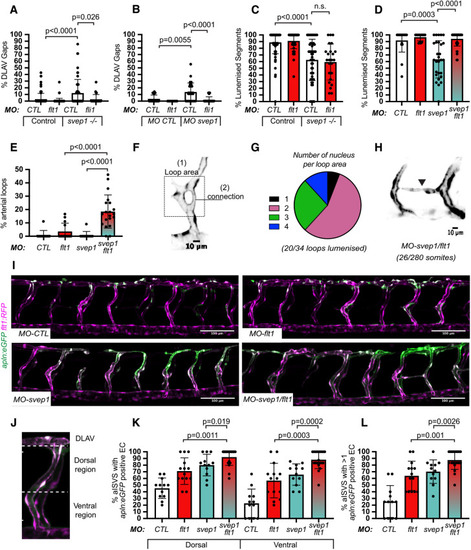
svep1 loss-of-function and knockdown are rescued by flt1 knockdown. (A) Bilateral quantifications of the percentage of gaps in the DLAV at 48 hpf in controls and svep1hu4767−/− embryos injected with MO-CTL (5 ng) (n=45 and n=27, respectively) or MO-flt1 (1 ng) (n=50 and n=12, respectively), and treated with 1× tricaine from 30 to 48 hpf (N=3). (B) Bilateral quantifications of the percentage of gaps in the DLAV at 48 hpf in MO-CTL (5 ng) (n=9), MO-flt1 (1 ng) (n=7), MO-svep1 (5 ng) (n=14) embryos (N=3), and treated with 1× tricaine from 30 to 48 hpf. (C) Bilateral quantifications of the percentage of lumenised segments in the DLAV at 48 hpf in controls and mutant svep1512−/− injected with MO-CTL (5 ng) (n=45 and n=27, respectively) or MO-flt1 (1 ng) (n=50 and n=12, respectively) and treated with 1× tricaine from 30 to 48 hpf (N=3). (D) Bilateral quantifications of the percentage of lumenised segments in the DLAV at 48 hpf in MO-CTL (5 ng) (n=9), MO-flt1 (1 ng) (n=7), MO-svep1 (5 ng) (n=14) and MO-flt1 (1 ng)/MO-svep1 (5 ng) (n=25) embryos (N=3). (E) Bilateral quantifications of the percentage of aISV loops at 48 hpf in MO-CTL (5 ng) (n=11), MO-flt1 (1 ng) (n=14), MO-svep1 (5 ng) (n=11) and MO-flt1 (1 ng)/MO-svep1 (5 ng) (n=20) embryos (N=3). (F) Representative image of an arterial aISV loop in MO-svep1 (5 ng)/MO-flt1 (1 ng) Tg(-0.8flt1:RFP)hu3333 embryos at 48 hpf, treated with 1× (0.014%) tricaine from 30 to 48 hpf. (G) Quantification of number of nuclei per loop area (see Fig. 4F) at 48 hpf in MO-svep1 (5 ng)/MO-flt1 (1 ng) embryos at 48 hpf, treated with 1× (0.014%) tricaine from 30 to 48 hpf (n=34 loops counted: 2, 19, 9 and 4 loops had 1, 2, 3 or 4 nuclei per loop area, respectively; 20/34 loops were lumenised) (N=3). (H) Representative image of an aISV-to-aISV connection in the region of the horizontal myoseptum at 48 hpf in in MO-svep1 (5 ng)/MO-flt1 (1 ng) Tg(-0.8flt1:RFP)hu3333 embryos at 48 hpf, treated with 1× (0.014%) tricaine from 30 to 48 hpf (n=20 fish, 26 connections visible out of 280 somites, 8/26 connections were lumenised) (N=3). (I) Maximum intensity projection of a representative TgBAC(apln:eGFP)bns157, Tg(-0.8flt1:RFP)hu5333 morphant embryo at 48 hpf. The panels show the GFP signal volume masked by the RFP signal to limit detection to the endothelium in MO-CTL (5 ng), MO-flt1 (1 ng), MO-svep1 (5 ng) and MO-svep1 (5 ng)/MO-flt1 (1 ng) embryos treated with 1× (0.014%) tricaine from 30 to 48 hpf. (J) Maximum intensity projection of a MO-svep1 (5 ng)/MO-flt1 (1 ng) aISV at 48 hpf, highlighting the ventral and dorsal region used for further quantifications in K. (K) Quantification of the percentage of aISVs with apln:eGFP-positive endothelial cells in the dorsal and ventral regions in 48 hpf MO-CTL (5 ng) (n=12), MO-flt1 (1 ng) (n=14), MO-svep1 (5 ng) (n=12) and MO-svep1(5 ng)/MO-flt1 (1 ng) (n=20) morphant embryos treated with 1× (0.014%) tricaine from 30 to 48 hpf (N=3). (L) Quantification of the percentage of aISVs with more than one apln:eGFP-positive endothelial cell in 48 hpf MO-CTL (5 ng) (n=12), MO-flt1 (1 ng) (n=14), MO-svep1 (5 ng) (n=12) and MO-svep1 (5 ng)/MO-flt1 (1 ng) (n=20) morphant embryos treated with 1× (0.014%) tricaine from 30 to 48 hpf (N=3). Data are mean±s.d. Mann–Whitney test. Scale bars: 10 μm (H); 100 μm (I).
|
