
- Title
-
Metabolomic and Transcript Analysis Revealed a Sex-Specific Effect of Glyphosate in Zebrafish Liver
- Authors
- Giommi, C., Ladisa, C., Carnevali, O., Maradonna, F., Habibi, H.R.
- Source
- Full text @ Int. J. Mol. Sci.

Figure 1. PCA score plot of CTRL and GLY metabolic profile in female and male livers. PCA score scatter plot of CTRL (red) vs. GLY (green) and QC (blue) in (a) female and (b) male livers. The abscissa axis shows the PC1 while the ordinate axis shows the PC2; the percentage of total variance for each PC is shown in parentheses. All samples are comprised within the 95% confidence interval of their respective group showing the absence of outliers. QC samples show strong cluster formation. |

Figure 2. PLS-DA score plot and hierarchical analysis in CTRL and GLY females and males. PLS-DA score scatter plot of CTRL (green) vs. GLY (blue) in (a) females and (b) males. (c,d) Quality parameters (R2 and Q2) and p-value of the two PLS-DA-built models in females and males, respectively. Hierarchical analysis of CTRL (green) vs. GLY (blue) in (e) females and (f) males. |
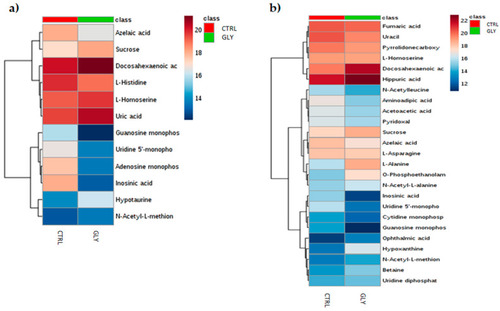
Figure 3. Clustered heatmap of VIP > 1 in CTRL and GLY-exposed female and male livers. Heatmap showing the VIP > 1 metabolites found in multivariate analysis (PLS-DA) of CTRL vs. GLY in (a) females and (b) males. Euclidean distance was used to perform clustering analysis. The heatmaps were constructed using Ward’s algorithm and samples are shown as group average. Increase and decrease in metabolite concentration are indicated by red and blue shades, respectively; the more intense is the color, the greater the increase or the decrease. |
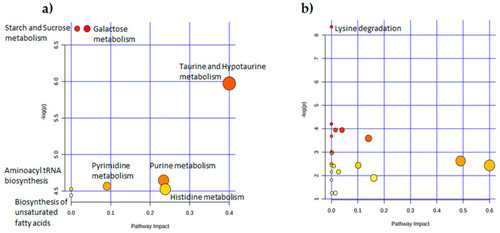
Figure 4. Dot plot of GLY-modulated pathways in the liver. MetPA graph showing main altered metabolic pathways found in CTRL vs. GLY comparison in (a) females and (b) males. The color of the dot (from white to red) reflects the significance (FDR < 0.05) of the pathway. The dimension of the dots reflects the impact of the metabolites in that pathway, the bigger the dot, the greater the impact of the metabolites in the pathway. The names of the pathways that were statistically significantly altered (FDR < 0.05) are reported. |
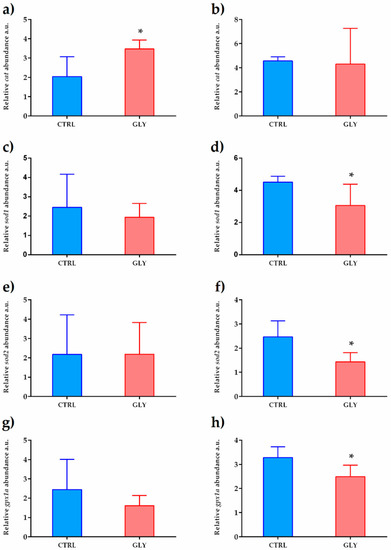
Figure 5. Gene expression profiles of hepatic oxidative stress response biomarkers. cat (a,b) sod1 (c,d), sod2 (e,f), and gpx1a (g,h) mRNA levels in female and male livers, respectively, normalized against rplp0 and rplp13 in CTRL and GLY-exposed zebrafish. Data are shown as mean ± SD (n = 5) and were analyzed by the t-test. Asterisks above each column denote significant differences between the experimental groups (* p < 0.05).
|
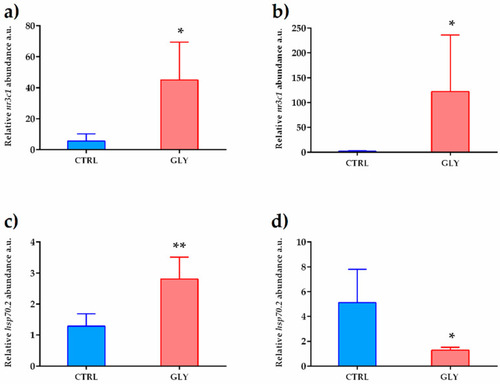
Figure 6. Gene-expression profile of stress-response biomarkers. nr3c1 (a,b) and hsp70.2 (c,d) mRNA levels in female and male livers, respectively, normalized against rplp0 and rplp13 in CTRL and GLY-exposed zebrafish. Data are shown as mean ± SD (n = 5) and were analyzed by the t-test. Asterisks above each column denote significant differences between the experimental groups (* p < 0.05, ** p < 0.01).
|
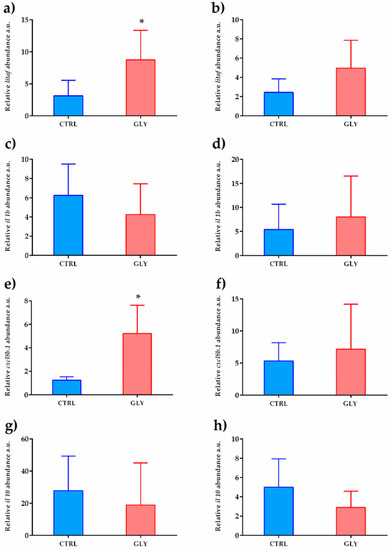
Figure 7. Gene expression profile of immune system biomarkers. litaf (a,b), il1b (c,d), cxcl8b.1 (e,f), and il10 (g,h) mRNA levels in female and male livers, respectively, normalized against rplp0 and rplp13 in CTRL and GLY-exposed zebrafish. Data are shown as mean ± SD (n = 5) and were analyzed by the t-test. Asterisks above each column denote significant differences between the experimental groups (* p < 0.05).
|

Figure 8. Gene expression profiles of hepatic esr1. esr1 mRNA levels in female and male livers normalized against rplp0 and rplp13 in CTRL and GLY-exposed zebrafish. Data are shown as mean ± SD (n = 5) and were analyzed by two-way ANOVA followed by Tukey’s multiple comparison test. Letters above each column denote significant differences among the experimental groups (p < 0.05).
|