
FIGURE
Figure 6
- ID
- ZDB-FIG-220314-31
- Publication
- Giommi et al., 2022 - Metabolomic and Transcript Analysis Revealed a Sex-Specific Effect of Glyphosate in Zebrafish Liver
- Other Figures
- All Figure Page
- Back to All Figure Page
Figure 6
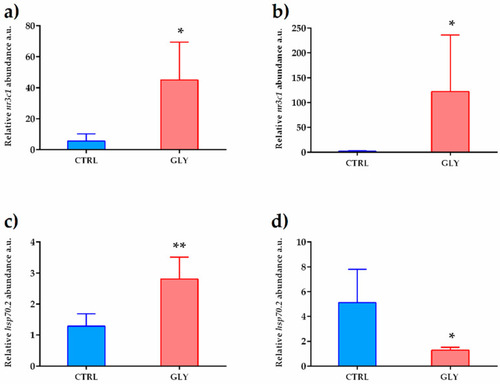
Figure 6. Gene-expression profile of stress-response biomarkers. nr3c1 (a,b) and hsp70.2 (c,d) mRNA levels in female and male livers, respectively, normalized against rplp0 and rplp13 in CTRL and GLY-exposed zebrafish. Data are shown as mean ± SD (n = 5) and were analyzed by the t-test. Asterisks above each column denote significant differences between the experimental groups (* p < 0.05, ** p < 0.01).
|
Expression Data
Expression Detail
Antibody Labeling
Phenotype Data
Phenotype Detail
Acknowledgments
This image is the copyrighted work of the attributed author or publisher, and
ZFIN has permission only to display this image to its users.
Additional permissions should be obtained from the applicable author or publisher of the image.
Full text @ Int. J. Mol. Sci.