
Image
|
Figure Caption
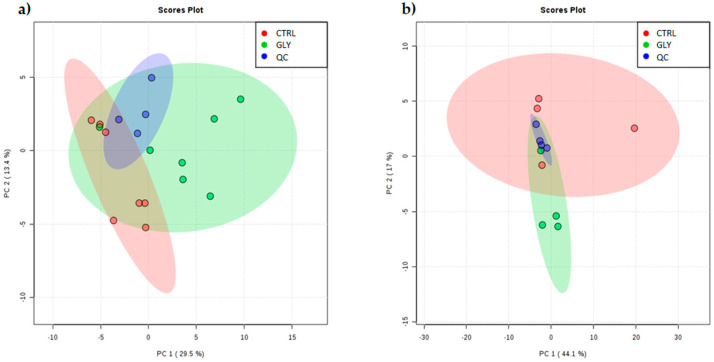
Figure 1 Figure 1. PCA score plot of CTRL and GLY metabolic profile in female and male livers. PCA score scatter plot of CTRL (red) vs. GLY (green) and QC (blue) in (a) female and (b) male livers. The abscissa axis shows the PC1 while the ordinate axis shows the PC2; the percentage of total variance for each PC is shown in parentheses. All samples are comprised within the 95% confidence interval of their respective group showing the absence of outliers. QC samples show strong cluster formation.
Acknowledgments
This image is the copyrighted work of the attributed author or publisher, and
ZFIN has permission only to display this image to its users.
Additional permissions should be obtained from the applicable author or publisher of the image.
Full text @ Int. J. Mol. Sci.