
Image
|
Figure Caption
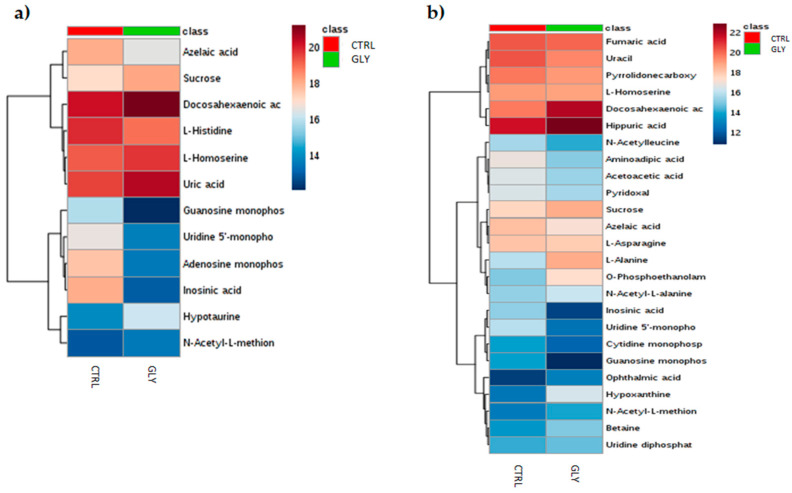
Figure 3 Figure 3. Clustered heatmap of VIP > 1 in CTRL and GLY-exposed female and male livers. Heatmap showing the VIP > 1 metabolites found in multivariate analysis (PLS-DA) of CTRL vs. GLY in (a) females and (b) males. Euclidean distance was used to perform clustering analysis. The heatmaps were constructed using Ward’s algorithm and samples are shown as group average. Increase and decrease in metabolite concentration are indicated by red and blue shades, respectively; the more intense is the color, the greater the increase or the decrease.
Acknowledgments
This image is the copyrighted work of the attributed author or publisher, and
ZFIN has permission only to display this image to its users.
Additional permissions should be obtained from the applicable author or publisher of the image.
Full text @ Int. J. Mol. Sci.