
- Title
-
Deficiency of nde1 in zebrafish induces brain inflammatory responses and autism-like behavior
- Authors
- Zhang, Q., Li, T., Lin, J., Zhang, Y., Li, F., Chen, X., Wang, X., Li, Q.
- Source
- Full text @ iScience

nde1 Expression analysis and generation of nde1 deficiency zebrafish (A) Relative expression of nde1 in zebrafish embryos during early development. Data are represented as mean ± SEM. (B) Relative expression of nde1 in zebrafish brain during five dpf to six mpf. (C–G) Whole mount in situ hybridization of nde1 during early development. Scale bar: 0.2 mm. (D′) Amplified images of boxed area in (D). (H) Diagram of target site on second exon of zebrafish nde1 genomic DNA, representative sequencing results and predicted ORF sequence of nde1+/+ and nde1−/−; red letter indicates N20 sequence; blue letter indicates NGG. (I) Reduced expression of nde1 mRNA in the brain of 6 mpf nde1−/− zebrafish. ∗∗∗p < 0.001. Data are represented as mean ± SEM |
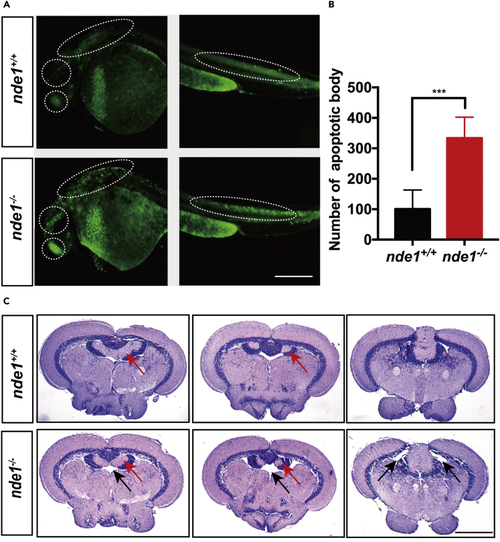
Morphological analysis and apoptosis analysis of nde1−/− (A) AO staining of nde1+/+ and nde1−/− at 30hpf; white dotted oval indicates telencephalon, midbrain, rhombomere, and spine, respectively. Scale bar: 0.2 mm. (B) Statistics of apoptotic bodies after AO staining in nde1+/+ and nde1−/−. (C) HE-stained paraffin sections of midbrain of nde1+/+ and nde1−/−. Black arrow indicates the gaps between the ventricles; red arrow indicates valvula cerebelli. Scale bar: 0.5 mm. ∗p < 0.05, ∗∗p < 0.01, ∗∗∗p < 0.001. Data are represented as mean ± SEM |
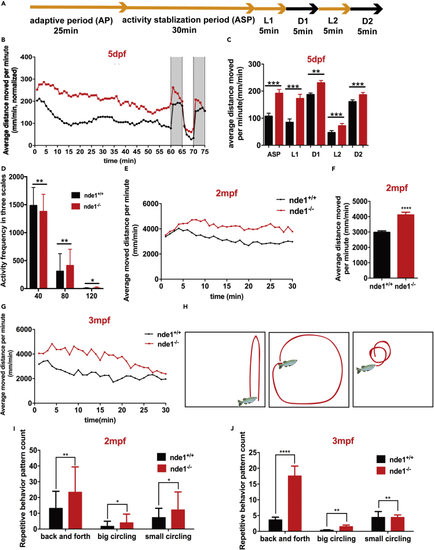
Zebrafish locomotor activity at 5 dpf, 2 mpf, and 3 mpf (A) Experimental setup of analysis of 5 dpf locomotor activity. (B) nde1+/+ and nde1−/− larvae (5 dpf) movement trend line graph within 75 min of the experiment time (n = 36). (C) Comparison of locomotor activity between nde1 nde1+/+ and nde1−/− larvae (5 dpf). (D) Activity frequency of ASP at three intensity scales. (E and G) 2 mpf (E, n = 32) and 3 mpf (G, n = 28) nde1+/+ and nde1−/− zebrafish movement trend graph within 30 min of the experiment time. (F) Comparison of 20 min ASP of locomotor activity of two mpf nde1+/+ and nde1−/− zebrafish. (H) Representative trace of back and forth, big circling and small circling of nde1−/− zebrafish. (I and J) 2 mpf (I) and three mpf (J) nde1−/− zebrafish showed more repetitive behaviors than nde1+/+. Data are shown as mean ± SEM; ∗p < 0.05, ∗∗p < 0.01, ∗∗∗p < 0.001, ∗∗∗∗p < 0.0001. |
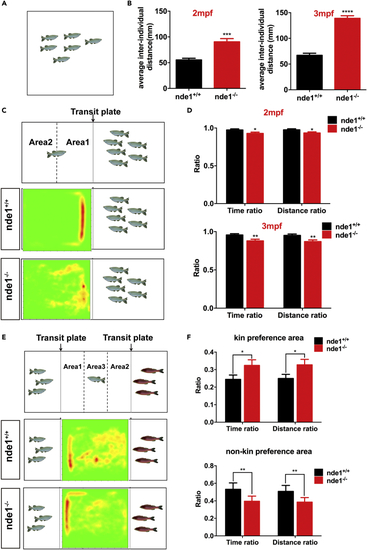
Social behavior analysis of nde1−/− zebrafish (A) Schematic of shoaling test. (B) Significantly increased inter-fish distance of 2 mpf (n = 10) and 3 mpf (n = 10) nde1−/− zebrafish. (C) Schematic and representative heatmap of social preference test; area1: social area, area2: nonsocial area. (D) Time ratio and distance ratio in the social area were significantly reduced in 2 mpf (n = 35) and 3 mpf (n = 28) nde1−/− zebrafish compared with nde1+/+ zebrafish. (E) Schematic and representative heatmap of kin recognition and preference test; area1: kin preference area, area2: nonkin preference area. (F) Significantly increased ratio of kin preference area entering and decreased ratio of nonkin preference area entering in 3 mpf nde1−/− zebrafish (n = 28). Data are presented as mean ± SEM; ∗p < 0.05, ∗∗p < 0.01, ∗∗∗p < 0.001, ∗∗∗∗p < 0.0001 PHENOTYPE:
|
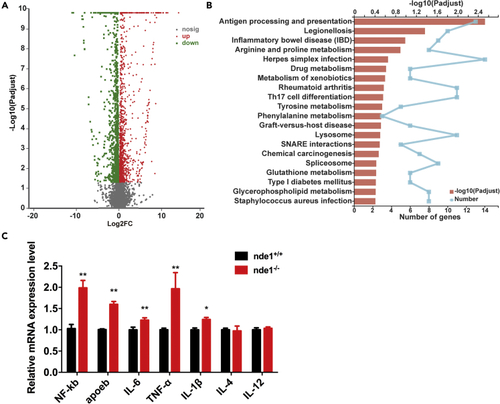
Transcriptome analysis of two mpf nde1−/− zebrafish brain tissue (A) Volcano plot of the gene expression profiles. Gray plot indicates no significance; red plot indicates upregulated genes; green plot indicates downregulated genes. (B) Twenty signaling pathways with the strongest significant differences in KEGG analysis. (C) Inflammatory cytokine and immune molecules expression in two mpf zebrafish brain tissue (n = 5). Data are presented as mean ± SEM; ∗p < 0.05, ∗∗p < 0.01 EXPRESSION / LABELING:
PHENOTYPE:
|

nde1 mRNA rescue mitosis, apoptosis, and immune-related phenotype (A–C). Relative expression level of bicd2, gmnn, pcna, pidd1, bbc3, bcl2a, and bcl2l1, apoeb in nde1+/+, nde1−/−, and nde1 mRNA rescued zebrafish. (D) AO staining of nde1+/+, nde1−/−, and nde1 mRNA rescued zebrafish at 28 hpf. White dotted oval indicates telencephalon, midbrain, rhombomere, and spine, respectively. Scale bar: 0.2 mm. (E) Statistics of apoptotic bodies after AO staining. ∗p < 0.05, ∗∗p < 0.01, ∗∗∗p < 0.001. Data are presented as mean ± SEM |
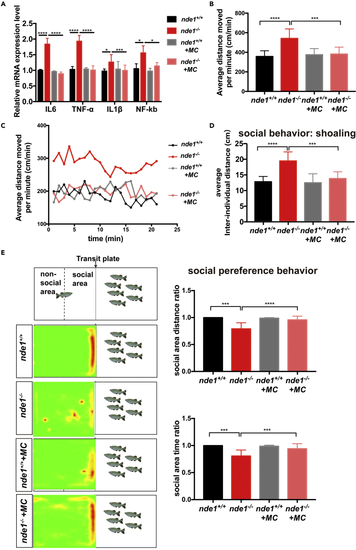
Analysis of brain inflammatory response and behavior of minocycline treated zebrafish (A) Relative expression level of IL-6, TNF-α, IL-1β, and NF-kb in nde1+/+, nde1−/−, and minocycline-treated zebrafish. (B and C) Locomotor activity (B) and movement trend graph (C) of 3.5 mpf nde1+/+, nde1−/−, nde1+/+ treated with MC, and nde1−/− treated with MC, n = 12. (D) Inter-fish distance of four groups of zebrafish in shoaling behavior analysis (n = 10). (E) Schematic and representative heatmap of social preference test. Time ratio and distance ratio in the social area were displayed (n = 10). ∗p < 0.05, ∗∗p < 0.01, ∗∗∗p < 0.001, ∗∗∗∗p < 0.0001. Data are presented as mean ± SEM |

ZFIN is incorporating published figure images and captions as part of an ongoing project. Figures from some publications have not yet been curated, or are not available for display because of copyright restrictions. PHENOTYPE:
|