Fig. 1
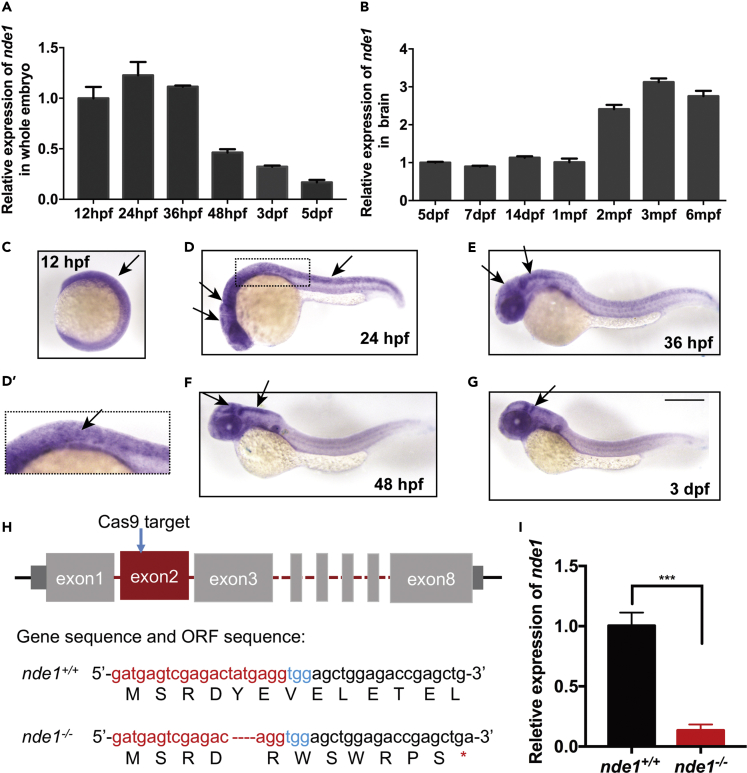
nde1 Expression analysis and generation of nde1 deficiency zebrafish
(A) Relative expression of nde1 in zebrafish embryos during early development. Data are represented as mean ± SEM.
(B) Relative expression of nde1 in zebrafish brain during five dpf to six mpf.
(C–G) Whole mount in situ hybridization of nde1 during early development. Scale bar: 0.2 mm.
(D′) Amplified images of boxed area in (D).
(H) Diagram of target site on second exon of zebrafish nde1 genomic DNA, representative sequencing results and predicted ORF sequence of nde1+/+ and nde1−/−; red letter indicates N20 sequence; blue letter indicates NGG.
(I) Reduced expression of nde1 mRNA in the brain of 6 mpf nde1−/− zebrafish. ∗∗∗p < 0.001. Data are represented as mean ± SEM

