
- Title
-
The Fibrillin-1/VEGFR2/STAT2 signaling axis promotes chemoresistance via modulating glycolysis and angiogenesis in ovarian cancer organoids and cells
- Authors
- Wang, Z., Chen, W., Zuo, L., Xu, M., Wu, Y., Huang, J., Zhang, X., Li, Y., Wang, J., Chen, J., Wang, H., Sun, H.
- Source
- Full text @ Cancer Commun (Lond)
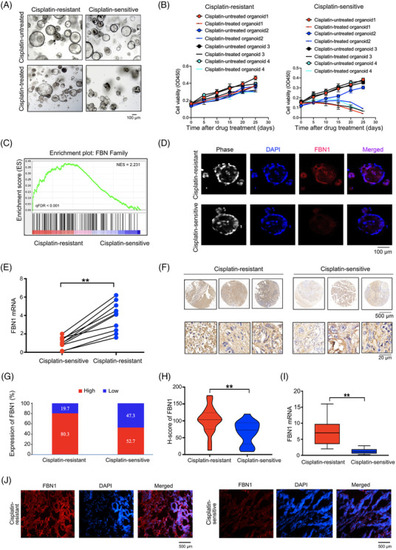
FBN1 expression level is associated with cisplatin‐resistance in patients with ovarian cancer. (A) Images of cisplatin‐resistant and ‐sensitive organoids derived from ovarian cancer patients with or without 5 μg/L cisplatin treatment for 21 days. (B) Cell viability assay of organoids treated with 5 μg/L cisplatin in different time intervals. The data of 4 pairs of ovarian cancer organoids are shown. Data are presented as mean ±SD of triplicate measurements repeated three times. (C) GSEA analysis was performed using 6 cisplatin‐resistant and 6 ‐sensitive organoids derived from ovarian cancer patients. (D) Immunofluorescence assay was performed to detect the association between FBN1 and cisplatin‐sensitive ovarian cancer organoids. (E) FBN1 mRNA expression in 10 pairs of cisplatin‐resistant and ‐sensitive organoids of ovarian cancer. (F) Representative images of immunohistochemistry staining of FBN1 in 132 cisplatin‐resistant and 129 ‐sensitive ovarian cancer tissues. (G) High‐low expression ratio of FBN1 in cisplatin‐resistant and ‐sensitive ovarian cancer tissues. (H) H‐score of FBN1 in cisplatin‐resistant and ‐sensitive ovarian cancer tissues. (I) qRT‐PCR analysis of FBN1 mRNA expression in 45 pairs of cisplatin‐resistant and ‐sensitive ovarian cancer tissues. (J) Immunofluorescence of FBN1 in cisplatin‐resistant and ‐sensitive ovarian cancer tissues. Red signals, FBN1; blue signals, DAPI. **, P < 0.01. Abbreviations: FBN1, fibrillin‐1; SD, standard deviation; GSEA, Gene Set Enrichment Analysis; qRT‐PCR, quantitative real‐time PCR; DAPI, 2‐(4‐Amidinophenyl)‐6‐indolecarbamidine dihydrochloride |
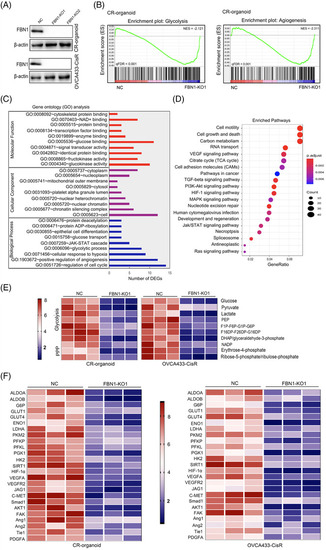
FBN1 knockout decreases glycolysis and angiogenesis. (A) FBN1‐knockout cisplatin‐resistant ovarian cancer organoids and cell lines were verified by Western blotting. (B) GSEA analysis was performed using FBN1‐knockout and control cisplatin‐resistant ovarian cancer organoids (CR‐organoid/FBN1‐KO1 and NC). The signature was defined by genes showing significant expression changes. (C) Gene ontology of mass spectrum analysis in CR‐organoid/FBN1‐KO1 and CR‐organoid/NC. (D) Pathway examination of mass spectrum analysis in CR‐organoid/FBN1‐KO1 and CR‐organoid/NC. (E) Metabolites in pathways of glucose metabolism. (F) mRNA levels of genes altered by FBN1 knockout in cisplatin‐resistant ovarian cancer organoids and cell lines. Abbreviations: FBN1, fibrillin‐1; GSEA, Gene Set Enrichment Analysis; CR, cisplatin‐resistant; KO, knockout; NC, negative control |
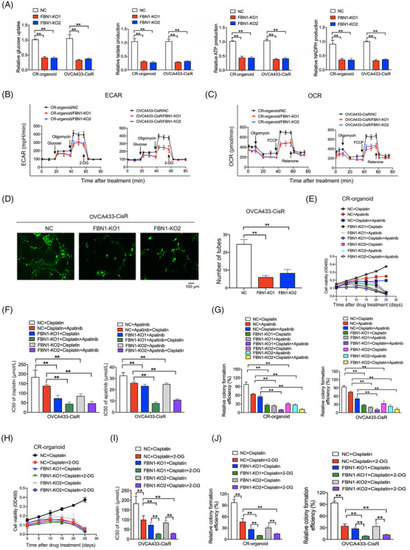
FBN1 knockout inhibits glycolysis and angiogenesis, leading to increased cisplatin sensitivity in cisplatin‐resistant ovarian cancer organoids and cells. (A) Glucose uptake, lactate, ATP and NADPH production in cisplatin‐resistant ovarian cancer organoids and cell line. Data are presented as mean ± SD of triplicate measurements repeated three times. (B‐C) ECAR (B) and OCR (C) in cisplatin‐resistant ovarian cancer organoids and cells. (D) Effect of FBN knockout on HUVEC tube formation. HUVEC cells were treated with supernatant obtained from OVCA433‐CisR/FBN1‐KO1, OVCA433‐CisR/FBN1‐KO2, or the corresponding control cells. (E) Cell viability assay of organoids treated with 5 μg/L cisplatin and/or 20 μmol/L apatinib in different time intervals. (F) IC50 values of cisplatin for FBN1‐knockout and control ovarian cancer cells treated with different concentrations of cisplatin for 48 h with or without 20 μmol/L apatinib; IC50 values of apatinib for the cells treated with various concentrations of apatinib for 48 h with or without 2.5 μg/mL cisplatin. (G) Relative colony formation efficiency of cisplatin‐resistant ovarian cancer organoids and cells treated without drugs or with 2.5 μg/mL cisplatin and/or 20 μmol/L apatinib for 7 days. (H) Cell viability assay of organoids treated with 5 μg/L cisplatin alone or in combination with 2.5 mmol/L 2‐DG in different time intervals. (I) IC50 values of cisplatin for ovarian cancer cells treated with different concentrations of cisplatin with or without 5 mmol/L 2‐DG for 48 h. (J) Relative colony formation efficiency of cisplatin‐resistant ovarian cancer organoids and cells treated with 2.5 μg/mL cisplatin alone or in combination with 2.5 mmol/L 2‐DG for 7 days. **, P < 0.01. Abbreviations: FBN1, fibrillin‐1; SD, standard deviation; CR: cisplatin‐resistant; KO, knockout; NC, negative control; ECAR, extracellular acidification rate; OCR, oxygen consumption rate; HUVECs, human umbilical vein endothelial cells. IC50, half maximal inhibitory concentration; 2‐DG, 2‐deoxy‐D‐glucose |
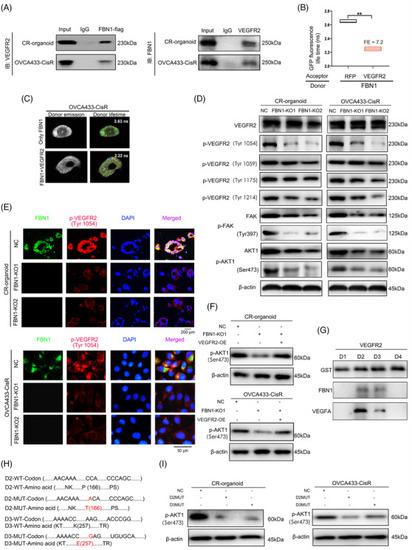
FBN1 combines directly with VEGFR2 in ovarian cancer cells. (A) Co‐IP assay of interactions between FBN1 and VEGFR2 proteins in cisplatin‐resistant ovarian cancer organoids and OVCA433‐CisR cells. (B‐C) Interactions between FBN1 and VEGFR2 confirmed by FRET‐FLIM upon transient co‐expression in OVCA433‐CisR cells. **, P < 0.01. (D) Western blotting assay for determining the relationship between FBN1 and VEGFR2, p‐VEGFR2, downstream molecules of VEGFR2‐mediated signaling in ovarian cancer cells. (E) Immunofluorescence assay for determining the relationship between FBN1 and p‐VEGFR2 (Tyr1054) in cisplatin‐resistant ovarian cancer organoids and cell lines. Green signals, FBN1; red signals, p‐VEGFR2 (Tyr1054); blue signals, DAPI. (F) Western blotting assay of p‐AKT1 (Ser473) in cisplatin‐resistant ovarian cancer organoids and OVCA433‐CisR cells. (G) Co‐IP assay demonstrated an interaction between VEGFR2 domains 2 & 3 and FBN1 protein. Binding of VEGFA and the extracellular domains 2 & 3) of VEGFR2 was used as the positive control. (H) Mutant codons and amino acids of D2 and D3 of VEGFR2. (I) Western blotting assay of p‐AKT1 (Ser473) in cisplatin‐resistant ovarian cancer organoids and OVCA433‐CisR cells. Abbreviations: FBN1, fibrillin‐1; CR, cisplatin‐resistant; KO, knockout; NC, negative control; SDS‐PAGE, sodium dodecyl sulfate‐polyacrylamide gel electrophoresis; AKT, protein kinase B; Co‐IP, co‐Immunoprecipitation; VEGFR2, vascular endothelial growth factor receptor 2; DAPI, 2‐(4‐amidinophenyl)‐6‐indolecarbamidine dihydrochloride; FRET‐FLIM, Fӧrster resonance energy transfer‐fluorescence lifetime imaging. FE, FRET efficiency |
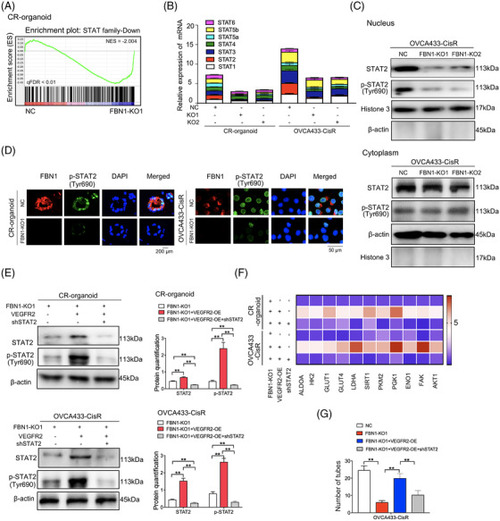
STAT2 is the downstream target molecule of the FBN1/VEGFR2 signaling axis. (A) GSEA analysis was performed using FBN1‐knockout and control cisplatin‐resistant ovarian cancer organoids (CR‐organoids/FBN1‐KO1 and CR‐organoids/NC). The signature was defined by genes showing significant expression changes. (B) Effects of FBN1 knockout on mRNA levels of STAT family members. (C) FBN1 knockout greatly altered the distribution and expression of STAT2 and p‐STAT2 (Tyr690) in cytoplasm and nucleus of OVCA433‐CisR ovarian cancer cells. (D) Immunofluorescence assay to determine the association between p‐STAT2 (Tyr690) and FBN1 in cisplatin‐resistant ovarian cancer organoids and cells. (E) Western blotting assay to detect expression of STAT2 and p‐STAT2 (Tyr690) in cisplatin‐resistant ovarian cancer organoids and OVCA433‐CisR cells. The protein quantification was analyzed by Image J software. (F) mRNA expression of glycolysis and angiogenesis‐associated genes in FBN1‐knockout and control cisplatin‐resistant ovarian cancer organoids and OVCA433‐CisR cells. (G) Effect of FBN1 knockout, VEGFR2 overexpression, and STAT2 knockdown on HUVEC tube formation. HUVEC cells were treated with supernatant obtained from groups of NC, FBN1 KO‐1, FBN1 KO‐1+VEGFR2 OE, and FBN1 KO‐1+VEGFR2 OE+shSTAT2 in OVCA433‐CisR cells. Abbreviations: FBN1, fibrillin‐1; CR, cisplatin‐resistant; KO, knockout; NC, negative control; OE, overexpression; STAT, signal transducer and activator of transcription; VEGFR2, vascular endothelial growth factor receptor 2 |
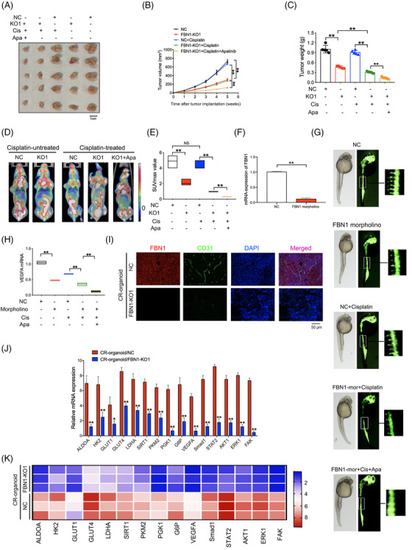
FBN1 knockout inhibits progression of ovarian cancer and sensitizes response to cisplatin in vivo. (A) Images of tumors generated by FBN1‐knockout and control cisplatin‐resistant ovarian cancer organoids with or without cisplatin and/or apatinib. (B) Growth curves of xenograft tumors in mice. (C) Average tumor weights in nude mice. (D) Representative images of PET‐CT used for detection of glucose uptake. Each group contained 5 mice. (E) Average SUVmax values of nude mice bearing tumors. (F) Effect of FBN1 morpholino in zebrafish model was tested by qRT‐PCR. (G) Zebrafish model treated with or without cisplatin (0.2 mmol/L) and/or apatinib (40 μmol/L). (H) VEGFA mRNA in zebrafish models. (I) Immunofluorescence of FBN1 and specific angiogenesis marker CD31 in the xenograft tumors of FBN1 knockout and control groups with cisplatin treatment. (J) qRT‐PCR analysis of the indicated genes in FBN1‐knockout group and the control in nude mouse tumor tissues without drug treatment. Error bars, 95% CIs. *, P < 0.05, **, P < 0.01. (K) Heatmap showing that FBN1‐affected genes are involved in glycolysis and angiogenesis with cisplatin treatment. Abbreviations: FBN1, fibrillin‐1; CR, cisplatin‐resistant; KO, knockout; NC, negative control; OE, overexpression; VEGFA, vascular endothelial growth factor A; qRT‐PCR, quantitative real‐time PCR; CD31, platelet endothelial cell adhesion molecule‐1 |
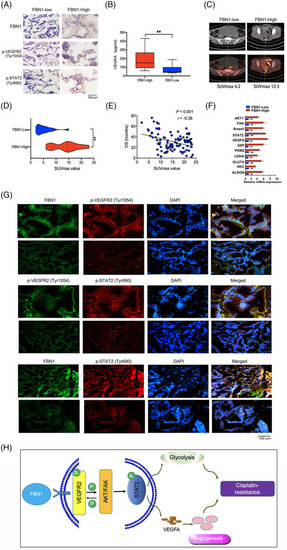
Immunohistochemical staining and immunofluorescence of FBN1, p‐VEGFR2, and p‐STAT2. (A) Representative images of immunohistochemistry of FBN1, p‐VEGFR2 (Tyr1054), and p‐STAT2 (Tyr690) in ovarian cancer tissues. (B) Human serum VEGFA concentration in 50 pairs of ovarian cancer patients measured by ELISA kit. (C‐D) Association between SUVmax of PET/CT technology and FBN1 expression in the lesions of adnexal carcinomas from 100 ovarian cancer patients. (E) The relationship between SUVmax of PET/CT image and overall survival of 100 ovarian cancer patients. (F) mRNA expression levels of genes associated with glycolysis and angiogenesis assessed via qRT‐PCR in 45 pairs of ovarian cancer samples with high or low FBN1 expression. (G) Representative images of immunofluorescence of FBN1, p‐VEGFR2 (Tyr1054), and p‐STAT2 (Tyr641) in ovarian cancer patients’ tissues. Green signals, FBN1 or p‐VEGFR2 (Tyr1054); red signals, p‐VEGFR2 (Tyr1054) or p‐STAT2 (Tyr641); blue signals, DAPI. (H) Schematic model on the proposed role of the FBN1/VEGFR2/STAT2 signaling axis in modulating glycolysis, angiogenesis, and cisplatin sensitivity. Abbreviations: FBN1, fibrillin‐1; ELISA, enzyme‐linked immunosorbent assay; SUVmax, maximum of standardized uptake value; PET‐CT, positron emission tomography‐computed tomography; VEGFA, vascular endothelial growth factor A; STAT2, signal transducer and activator of transcription 2; VEGFR2, vascular endothelial growth factor receptor 2; DAPI, 2‐(4‐amidinophenyl)‐6‐indolecarbamidine dihydrochloride |