
|
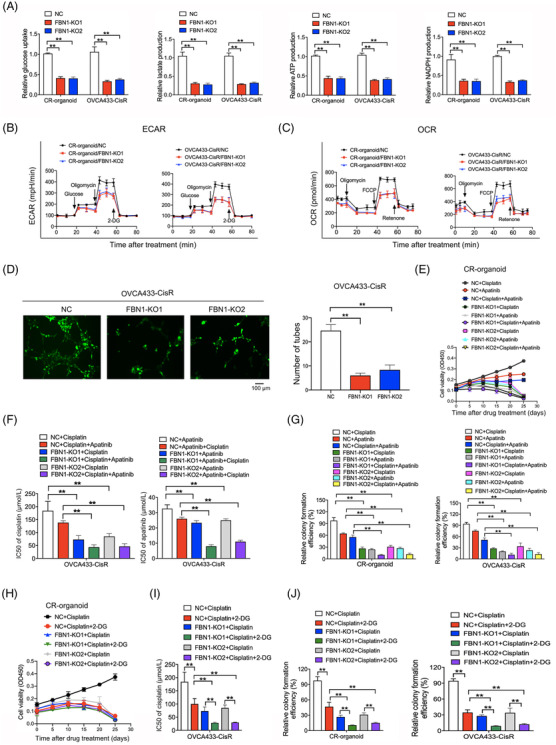
Fig. 3
FBN1 knockout inhibits glycolysis and angiogenesis, leading to increased cisplatin sensitivity in cisplatin‐resistant ovarian cancer organoids and cells. (A) Glucose uptake, lactate, ATP and NADPH production in cisplatin‐resistant ovarian cancer organoids and cell line. Data are presented as mean ± SD of triplicate measurements repeated three times. (B‐C) ECAR (B) and OCR (C) in cisplatin‐resistant ovarian cancer organoids and cells. (D) Effect of FBN knockout on HUVEC tube formation. HUVEC cells were treated with supernatant obtained from OVCA433‐CisR/FBN1‐KO1, OVCA433‐CisR/FBN1‐KO2, or the corresponding control cells. (E) Cell viability assay of organoids treated with 5 μg/L cisplatin and/or 20 μmol/L apatinib in different time intervals. (F) IC50 values of cisplatin for FBN1‐knockout and control ovarian cancer cells treated with different concentrations of cisplatin for 48 h with or without 20 μmol/L apatinib; IC50 values of apatinib for the cells treated with various concentrations of apatinib for 48 h with or without 2.5 μg/mL cisplatin. (G) Relative colony formation efficiency of cisplatin‐resistant ovarian cancer organoids and cells treated without drugs or with 2.5 μg/mL cisplatin and/or 20 μmol/L apatinib for 7 days. (H) Cell viability assay of organoids treated with 5 μg/L cisplatin alone or in combination with 2.5 mmol/L 2‐DG in different time intervals. (I) IC50 values of cisplatin for ovarian cancer cells treated with different concentrations of cisplatin with or without 5 mmol/L 2‐DG for 48 h. (J) Relative colony formation efficiency of cisplatin‐resistant ovarian cancer organoids and cells treated with 2.5 μg/mL cisplatin alone or in combination with 2.5 mmol/L 2‐DG for 7 days. **, P < 0.01. Abbreviations: FBN1, fibrillin‐1; SD, standard deviation; CR: cisplatin‐resistant; KO, knockout; NC, negative control; ECAR, extracellular acidification rate; OCR, oxygen consumption rate; HUVECs, human umbilical vein endothelial cells. IC50, half maximal inhibitory concentration; 2‐DG, 2‐deoxy‐D‐glucose