
- Title
-
HRAS germline mutations impair LKB1/AMPK signaling and mitochondrial homeostasis in Costello syndrome models
- Authors
- Dard, L., Hubert, C., Esteves, P., Blanchard, W., Bou About, G., Baldasseroni, L., Dumon, E., Angelini, C., Delourme, M., Guyonnet-Duperat, V., Claverol, S., Bonneu, M., Fontenille, L., Kissa, K., Séguéla, P.E., Thambo, J.B., Levy, N., Herault, Y., Bellance, N., Dias Amoedo, N., Magdinier, F., Sorg, T., Lacombe, D., Rossignol, R.
- Source
- Full text @ Journal of Clin. Invest.
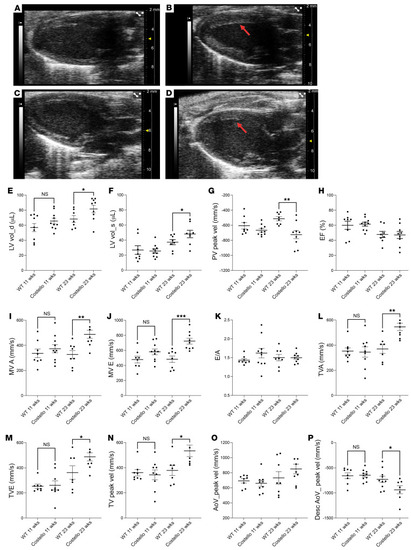
Hypertrophic cardiomyopathy in patients with CS and the mouse model. Parasternal echography was performed in (A and C) WT (HRAS) or (B and D) Costello (HRAS p.G12S) mice at 11 weeks (A and B) and 23 weeks (C and D) of age. Left ventricle hypertrophy is indicated by arrows. (E) Left ventricle volume at diastole (LV vol_d), (F) left ventricle volume at systole (LV vol_s), (G) pulmonary valve peak velocity (PV peak vel), (H) ejection fraction (EF), (I) mitral valve flow A wave maximal velocity (MV A), (J) mitral valve flow E wave maximal velocity (MV E), (K) E/A ratio, (L) tricuspid valve flow A wave maximal velocity (TVA), (M) tricuspid valve flow E wave maximal velocity (TVE), (N) tricuspid valve peak velocity (TV peak vel), (O) aorta peak velocity (AoV_peak vel), and (P) descending aorta peak velocity (Desc AoV_peak vel). The data are expressed as the mean ± SEM. *P < 0.05, **P < 0.01, ***P < 0.001 (unpaired t test was performed between the CS mouse group and the corresponding age-matched WT animals). HCM, hypertrophic cardiomyopathy. |
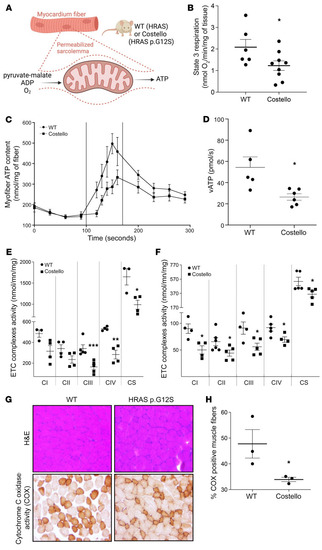
Mitochondrial bioenergetics is altered in situ in the CS mouse heart and skeletal muscle. (A) Permeabilized heart muscle fibers bioenergetics evaluation methods. (B) Rate of coupled (ADP-stimulated “state 3”) respiration was determined in situ using high-resolution respirometry (WT, n = 6; Costello, n = 9). (C and D) Rate of mitochondrial ATP synthesis (vATp) determined in heart-permeabilized muscle fibers (WT, n = 5; Costello, n = 6). (E) Electron transport chain (ETC) complex enzymatic activities determined in WT or Costello mouse model hearts (WT, n = 4; Costello, n = 4). (F) Respiratory chain complex enzymatic activities determined in WT or Costello mouse model skeletal muscle (WT, n = 4; Costello, n = 4). (G) Histo-enzymology staining of the respiratory chain complex IV (COX) specific activity. Muscle fibers and their nuclei were stained using H&E. Original magnification, ×1000. (H) Quantification of the COX-positive muscle fibers (WT, n = 3; Costello, n = 3). Data are expressed as the mean ± SEM. *P < 0.05, **P < 0.01, ***P < 0.001 (unpaired t test). |
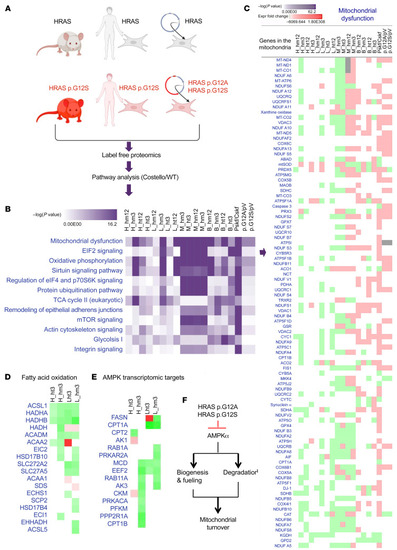
Mitochondrial proteostasis is compromised in Costello syndrome. (A) Description of the 3 types of Costello syndrome (CS) models used in the label-free proteomic analysis. A differential proteome was obtained between WT and CS models. Ingenuity Pathway Analysis (Qiagen; version 01-07) was used to perform a comparative analysis of the data. n = 3 was used for each sample. (B) Top canonical pathways altered in the CS biological models [ranked by –log(P value)]. (C) Detail of the changes in the “mitochondrial dysfunction” category (expression fold change; green, downregulation; red, upregulation). (D and E) Changes in the fatty acid oxidation and AMPK signaling (indirect transcriptomic targets) proteins detected in the hearts and livers of 3-week-old CS mice (heterozygous or homozygous HRAS p.G12S) compared with WT mice. (F) Working hypothesis on the effect of mutant HRAS p.G12A and HRAS p.G12S on mitochondrial biogenesis and degradation via inhibition of AMPK signaling. H, heart; B, brain; L, liver; M, skeletal muscle; ht, heterozygous; hm, homozygous; 3, 3-week-old mice; 12, 12-week-old mice; Pskf, patient skin fibroblasts; Cskf, control skin fibroblasts; p.G12A, human skin fibroblasts transduced with HRAS p.G12A–expressing lentiviral plasmid; p.G12S, human skin fibroblasts transduced with HRAS p.G12S–expressing lentiviral plasmid; pV, human skin fibroblasts transduced with empty lentiviral plasmid. |
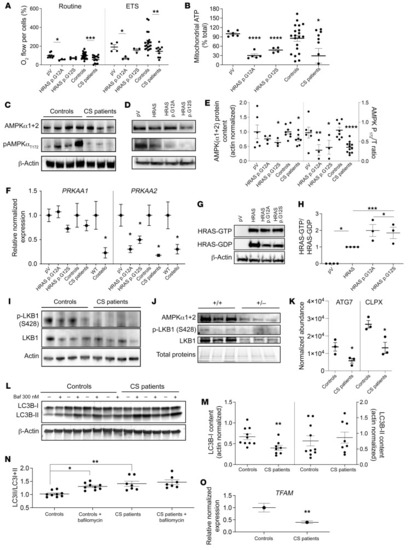
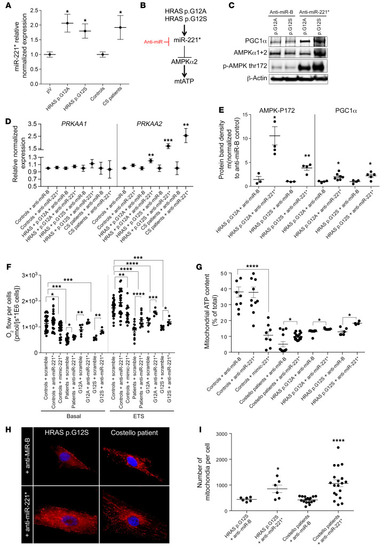
AMPKα2 expression is inhibited by mutant HRAS. (A) Mitochondrial respiration determined in skin fibroblasts from patients with CS and in WT human fibroblasts transduced with an empty plasmid (pV) or mutant forms of HRAS (n ≥ 3 for each condition). (B) Mitochondrial ATP content (expressed as a percentage of the total ATP) (n ≥ 3). (C) Total AMPK α subunits (α1+α2) and T172_phospho-AMPK protein content were quantified in cells from patients with CS (n = 6) and WT controls (n = 6). (Phospho-AMPK/[phospho-AMPK+total AMPK]) was denominated “AMPK P172/T_ratio.” (D and E) AMPK and T172_phospho-AMPK protein content determined in mutant HRAS-expressing human skin fibroblasts (pV, empty plasmid; HRAS, WT gene; HRAS p.G12A and HRAS p.G12S, mutated forms of the gene) (n ≥ 3). (F) mRNA content of 2 AMPK subunits (α1 and α2) in different CS models: CS mouse heart, fibroblasts from patients with CS, and mutant HRAS cell models (n = 3). (G and H) Effect of HRAS mutations on HRAS activity (n = 3). (I) LKB1 expression level and its S428 phosphorylation status on control fibroblasts (n = 7) and fibroblasts of patients with CS (n = 6). (J) Protein content of AMPKα1+α2, T172_phospho-AMPK, LKB1, and S428_P-LKB1 in heart samples from Costello (HRAs p.G12S) or WT (HRAS) mice. (K) Protein levels of ATG7 and CLPX determined by mass spectrometry in cells from patients with CS (n = 3) as compared with control cells (n = 3). (L and M) LC3B-I and LC3B-II levels were determined in skin fibroblasts from controls or patients in presence or absence of 300 nM of bafilomycin A1 (n = 3). (N) LC3 activation level was expressed as (LC3-II/[LC3I+LC3II]). (O) Relative normalized expression of TFAM mRNA in cells from patients with CS (n = 3). Data are expressed as the mean ± SEM. One-way ANOVA with Dunnett’s correction for multiple testing was used to compare the 3 groups of cells expressing HRAS p.G12A or HRAS p.G12S with the empty plasmid control, while a t test was used to compare the 2 groups of cells obtained from patients with CS and controls or the 2 groups of mice (Costello or WT). *P < 0.05, **P < 0.01, ***P < 0.001, ****P < 0.0001. |
( |
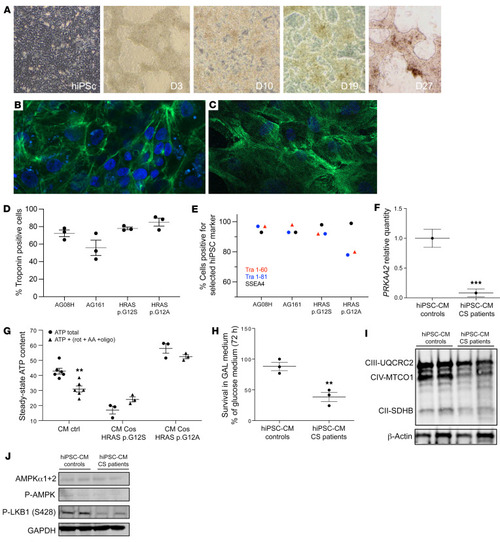
Mitochondrial bioenergetics is impaired in CS hiPSC-derived cardiomyocytes. (A) Human induced pluripotent stem cells (hiPSCs) were established by electroporation of different primary fibroblasts cell lines. Characterization of the hiPSC-derived cardiomyocytes using cardiac troponin T staining; 2 examples are shown for (B) the control AG08H and (C) the Costello G12S hiPSC-derived cardiomyocytes. Original magnification, ×40. (D) The percentage of Troponin T–positive cells determined using immunocytochemistry is shown for the 4 lineages of hiPSC-derived cardiomyocytes. (E) Expression of the keratin sulfate antigens Tra1-60 and Tra1-81 and the glycolipid antigen SSEA4 was verified by flow cytometry. (F) Determination of AMPKα2 (PRKAA2) mRNA expression level by Q-PCR in hiPSC-derived cardiomyocytes, obtained from 2 patients with CS and 2 controls (n = 3). (G) Measurement of the total cellular steady-state ATP content in hiPSC-derived cardiomyocytes, obtained from 2 patients with CS and 2 controls (n = 3). Evaluation of mitochondrial ATP synthesis was performed using inhibitors of oxidative phosphorylation: antimycin A, oligomycin, and rotenone. (H) Survival of the hiPSC-derived cardiomyocytes, obtained from 2 patients with CS and 2 controls, in an obligatory oxidative growth medium (n = 3). Data are expressed as percentage of the cell number in glucose medium. (I) Western blot evaluation of the expression level of various respiratory chain proteins on hiPSC-derived cardiomyocytes, obtained from 2 patients with CS and 2 controls, using the Oxphos kit from Abcam. (J) Determination of the protein expression level of AMPK, T172-P-AMPK and ser428P-LKB1. Protein loading was verified using the GAPDH marker. Data are expressed as the mean ± SEM. Unpaired t test was used to compare the 2 groups of hiPSC-CMs (controls and patients). For G, 1-way ANOVA with Dunnett’s correction was used to compare the 3 groups of cells. **P < 0.01, ***P < 0.001. |
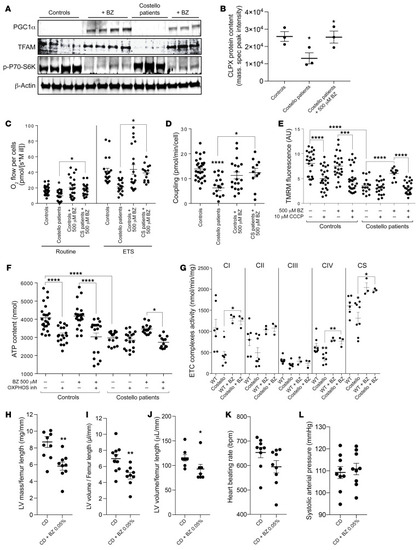
Bezafibrate rescues mitochondrial bioenergetics and prevents left ventricle cardiac hypertrophy in Costello syndrome. (A) Increased expression of PGC1α, TFAM, and p-P70S6K by bezafibrate (500 μM; 48 hours) treatment in skin fibroblasts from patients with CS. (B) CLPX protein content determined by mass spectrometry of cells from controls, cells from patients with CS, and bezafibrate-treated cells from patients with CS. Quantification was expressed as the normalized peak intensity (n = 3). (C–F) Defective mitochondrial respiration, OXPHOS coupling, mitochondrial transmembrane electric potential, and mitochondrial ATP levels were rescued by bezafibrate (500 μM; 48 hours) in skin fibroblasts from patients with CS (n = 3). (G) Stimulation of respiratory chain complex enzymatic activity in the hearts of CS mice treated with bezafibrate 0.05% in the diet (for 12 weeks). Effect of the bezafibrate 0.05% in chow diet (CD + BZ 0.05%) on (H) left ventricle (LV) mass, (I) left ventricle volume, (J) heart mass, (K) heart beating rate, and (L) systolic arterial pressure after 12 weeks of treatment in CS mouse model (n = 9) as compared with untreated CS mice fed with chow diet (CD) (n = 9). One-way ANOVA with Dunnett’s correction for multiple testing was used to compare the 4 groups of cells (controls treated or untreated with bezafibrate and CS mice treated or untreated with bezafibrate). Unpaired t test was used to compare the 2 groups of mice (WT or Costello). *P < 0.05, **P < 0.01, ***P < 0.001, ****P < 0.0001. |
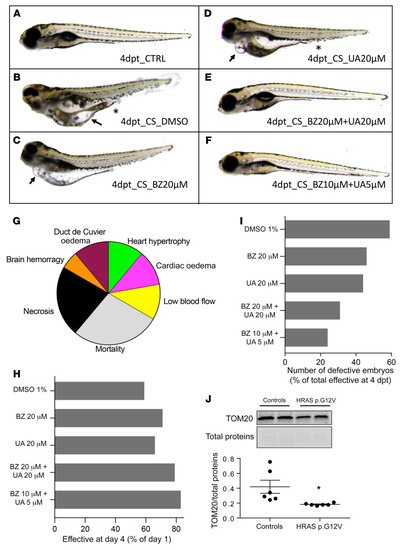
Combination of bezafibrate and urolithin A restores normal phenotype in Costello zebrafish. Phenotype analysis of (A) control zebrafish or (B–H) Costello zebrafish injected with HRASV12 plasmid at 5 dpf, after 4 days of treatment with (B) DMSO, (C) bezafibrate, (D) urolithin A, or (E and F) bezafibrate (BZ) and urolithin A (UA) in combination. Costello zebrafish developed edema (B–D, arrows) or hemorrhages and vascularization defects (B and D, asterisks). (F) Treatment with a combination of 10 μM BZ and 5 μM UA markedly reduced the percentage of abnormal embryos. (G) Illustration of the phenotypes observed in Costello zebrafish at 5 dpf after expression of HRASV12 plasmid. (H) Expression level of the mitochondrial protein TOM20 in control or HRAS p.G12V embryos. TOM20 protein content determined by Western blot was normalized to the total protein content. (I) Survival rate of Costello zebrafish after 4 days of treatment with DMSO, bezafibrate, or UA alone or in combination. Data were normalized to day 1 of treatment. (J) Percentage of defect appearance in Costello zebrafish after 4 days of treatment with DMSO, bezafibrate, or UA alone or in combination. Data are expressed as number of embryos or as the mean value of TOM20 expression. Unpaired t test was used to compare the 2 groups of zebrafish (WT or Costello). *P < 0.05. |