
Figure 4
- ID
- ZDB-FIG-220420-45
- Publication
- Dard et al., 2022 - HRAS germline mutations impair LKB1/AMPK signaling and mitochondrial homeostasis in Costello syndrome models
- Other Figures
- All Figure Page
- Back to All Figure Page
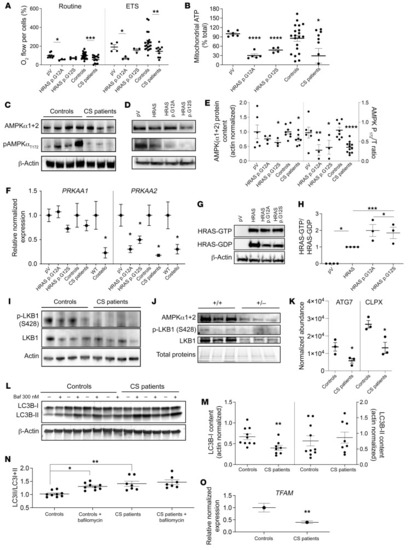
AMPKα2 expression is inhibited by mutant HRAS. (A) Mitochondrial respiration determined in skin fibroblasts from patients with CS and in WT human fibroblasts transduced with an empty plasmid (pV) or mutant forms of HRAS (n ≥ 3 for each condition). (B) Mitochondrial ATP content (expressed as a percentage of the total ATP) (n ≥ 3). (C) Total AMPK α subunits (α1+α2) and T172_phospho-AMPK protein content were quantified in cells from patients with CS (n = 6) and WT controls (n = 6). (Phospho-AMPK/[phospho-AMPK+total AMPK]) was denominated “AMPK P172/T_ratio.” (D and E) AMPK and T172_phospho-AMPK protein content determined in mutant HRAS-expressing human skin fibroblasts (pV, empty plasmid; HRAS, WT gene; HRAS p.G12A and HRAS p.G12S, mutated forms of the gene) (n ≥ 3). (F) mRNA content of 2 AMPK subunits (α1 and α2) in different CS models: CS mouse heart, fibroblasts from patients with CS, and mutant HRAS cell models (n = 3). (G and H) Effect of HRAS mutations on HRAS activity (n = 3). (I) LKB1 expression level and its S428 phosphorylation status on control fibroblasts (n = 7) and fibroblasts of patients with CS (n = 6). (J) Protein content of AMPKα1+α2, T172_phospho-AMPK, LKB1, and S428_P-LKB1 in heart samples from Costello (HRAs p.G12S) or WT (HRAS) mice. (K) Protein levels of ATG7 and CLPX determined by mass spectrometry in cells from patients with CS (n = 3) as compared with control cells (n = 3). (L and M) LC3B-I and LC3B-II levels were determined in skin fibroblasts from controls or patients in presence or absence of 300 nM of bafilomycin A1 (n = 3). (N) LC3 activation level was expressed as (LC3-II/[LC3I+LC3II]). (O) Relative normalized expression of TFAM mRNA in cells from patients with CS (n = 3). Data are expressed as the mean ± SEM. One-way ANOVA with Dunnett’s correction for multiple testing was used to compare the 3 groups of cells expressing HRAS p.G12A or HRAS p.G12S with the empty plasmid control, while a t test was used to compare the 2 groups of cells obtained from patients with CS and controls or the 2 groups of mice (Costello or WT). *P < 0.05, **P < 0.01, ***P < 0.001, ****P < 0.0001. |