
Figure 6
- ID
- ZDB-FIG-220420-47
- Publication
- Dard et al., 2022 - HRAS germline mutations impair LKB1/AMPK signaling and mitochondrial homeostasis in Costello syndrome models
- Other Figures
- All Figure Page
- Back to All Figure Page
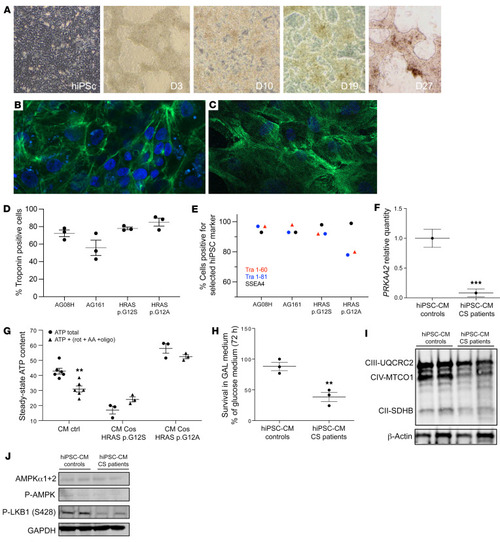
Mitochondrial bioenergetics is impaired in CS hiPSC-derived cardiomyocytes. (A) Human induced pluripotent stem cells (hiPSCs) were established by electroporation of different primary fibroblasts cell lines. Characterization of the hiPSC-derived cardiomyocytes using cardiac troponin T staining; 2 examples are shown for (B) the control AG08H and (C) the Costello G12S hiPSC-derived cardiomyocytes. Original magnification, ×40. (D) The percentage of Troponin T–positive cells determined using immunocytochemistry is shown for the 4 lineages of hiPSC-derived cardiomyocytes. (E) Expression of the keratin sulfate antigens Tra1-60 and Tra1-81 and the glycolipid antigen SSEA4 was verified by flow cytometry. (F) Determination of AMPKα2 (PRKAA2) mRNA expression level by Q-PCR in hiPSC-derived cardiomyocytes, obtained from 2 patients with CS and 2 controls (n = 3). (G) Measurement of the total cellular steady-state ATP content in hiPSC-derived cardiomyocytes, obtained from 2 patients with CS and 2 controls (n = 3). Evaluation of mitochondrial ATP synthesis was performed using inhibitors of oxidative phosphorylation: antimycin A, oligomycin, and rotenone. (H) Survival of the hiPSC-derived cardiomyocytes, obtained from 2 patients with CS and 2 controls, in an obligatory oxidative growth medium (n = 3). Data are expressed as percentage of the cell number in glucose medium. (I) Western blot evaluation of the expression level of various respiratory chain proteins on hiPSC-derived cardiomyocytes, obtained from 2 patients with CS and 2 controls, using the Oxphos kit from Abcam. (J) Determination of the protein expression level of AMPK, T172-P-AMPK and ser428P-LKB1. Protein loading was verified using the GAPDH marker. Data are expressed as the mean ± SEM. Unpaired t test was used to compare the 2 groups of hiPSC-CMs (controls and patients). For G, 1-way ANOVA with Dunnett’s correction was used to compare the 3 groups of cells. **P < 0.01, ***P < 0.001. |