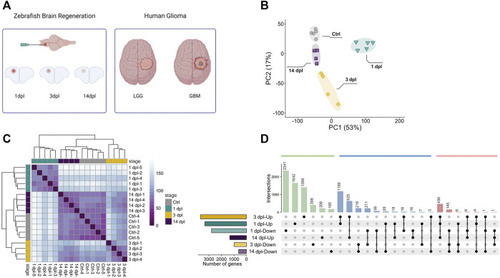
Sample preparation from three different stages of zebrafish brain regeneration and initial analyses of the transcriptome data. (A) Generation of the stab lesion and preparation of the RNA samples from lesioned hemispheres at 1, 3 and 14 dpl. Transcriptomes of the regenerating brain were compared to those of human adult LGG and GBM. (B) Principal component analysis (PCA) of three brain regeneration stages and their controls. Different colors of circle, square or rectangle dots represent the four groups of samples. Four or five dots with the same color refer to the biological replicates of a sample group. Four sample groups were well clustered among their replicates and well separated from other sample groups. (C) Sample-to-sample distance heatmap generated by using normalized counts for overall gene expression patterns for three stages of brain regeneration and control brain samples generated by the DESeq2 package. Different colors of dots represent the four groups of samples. (D) UpSet plot shows the comparison of DEG sets between regeneration stages. Total number of DEGs as Up or Down and time points are shown on x and y axes, respectively. Green bars represent the genes unique to a time point, blue bars the intersection of genes between two different time points and red bars the intersection of genes between three different time points. Black dots connected by lines correspond to the time point and Up/Down state. Numbers of overlapping genes are shown above each bar. dpl: days post-lesion, ctrl: control, LGG: low-grade glioma, GBM: glioblastoma, Up: upregulated, Down: downregulated.

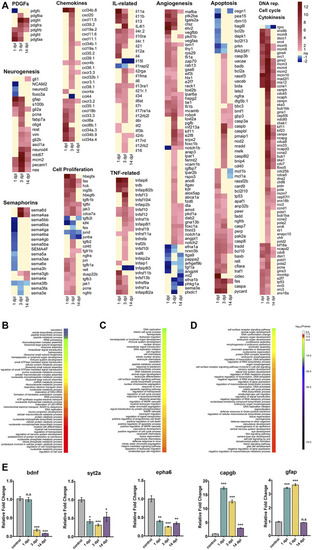
Transcriptome profiling and functional annotation of the telencephalon during early wound healing (1 dpl), early proliferative (3 dpl) and differentiation (14 dpl) stages of zebrafish brain regeneration. (A) Heatmaps of log2 fold changes of selected genes across three stages of brain regeneration. Each column represents a time point and each row shows a single gene. The scale bar shows red for Up, blue for Down, yellow for weak regulation (FC < 1.5 in either direction) or statistically non-significant (Benjamini–Hochberg adjusted p-value (FDR) > 0.1). (B–D) GO-BP terms enriched at 1 dpl (B), 3 dpl (C) and 14 dpl (D) by using all DEGs. DAVID was used to show the most significantly enriched GO-BP terms. All DEGs (1 dpl: 6,123, 3 dpl: 4,662, 14 dpl: 1954) were used for the analyses. The heatmap scale shows log10 of the ease p-values for the most significantly enriched GO terms. (E) Relative expression levels of genes that are Down or Up at different stages of regeneration. bdnf is Down at 3 dpl and 14 dpl, while syt2a and epha6 are Down at all stages. capgb is Up at all stages, while gfap is Up at 1 dpl and 3 dpl. Statistical significance was evaluated using unpaired t-test. *p < 0.05, **p < 0.01 and ***p < 0.001. ns: non-significant. Error bars represent ±standard error of mean (SEM, n = 3). Up: upregulated, Down: downregulated, dpl: days post-lesion, DAVID: database for Annotation, Visualization and Integrated Discovery, GO: Gene Ontology, BP: Biological Process.

EXPRESSION / LABELING:
Genes:
Fish:
Condition:
Anatomical Term:
Stage: Adult
PHENOTYPE:
Fish:
Condition:
Observed In:
Stage: Adult

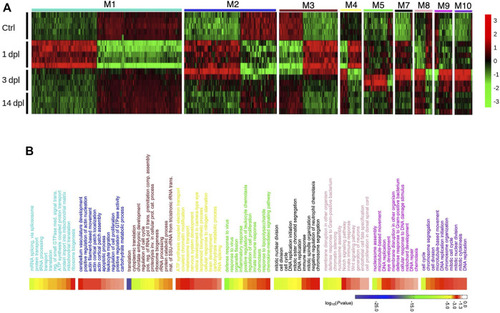
Network analysis of zebrafish brain regeneration at three stages reveals stage-specific modules. (A) Heatmap representing relative expression (z-score) of genes that are enriched in each module for the three stages of the adult zebrafish brain regeneration. Each row represents a sample, and each column shows a single gene. Red and green shades show high or low relative expressions, respectively. (B) DAVID was used to show the most significantly enriched GO-BP terms based on the transcriptional changes of each significant module and their associated enrichment p-values for Top 10 GO-BP terms. The heatmap scale shows log10 of the ease p-values for the most significantly enriched GO terms. dpl: days post-lesion, ctrl: control.

Early wound healing stage (1 dpl) of brain regeneration is similar to brain cancer with respect to induction of metabolism- and neurogenesis-related signaling responses. (A, B) Venn diagrams showing the number of upregulated (Up) or downregulated (Down) DEGs and the overlap between 1 dpl (turquoise) and (A) LGG (pink) and (B) GBM (blue). (C, D) Heatmaps show the expression of genes shared between 1 dpl (turquoise) and (C) LGG (pink) and (D) GBM (blue). Each column represents a condition (1 dpl, LGG or GBM) and each row shows a single gene. The scale bar shows log2 fold changes from high to low regulation, represented by a color gradient from red to purple, respectively. (E, F) DAVID was used to show the most significantly enriched GO-BP (top 50), CC (top 5), and MF (top 5) terms based on transcriptional changes in comparison of 1 dpl with (E) LGG and (F) GBM by using human identifiers of shared DEGs. The heatmap scale shows log10 of the ease p-values for the most significantly enriched GO terms. dpl: days post-lesion, DAVID: database for Annotation, Visualization and Integrated Discovery, GO: Gene Ontology, BP: Biological Process, MF: Molecular Function, CC: Cellular Component, dpl: days post lesion, LGG: low-grade glioma, GBM: glioblastoma.

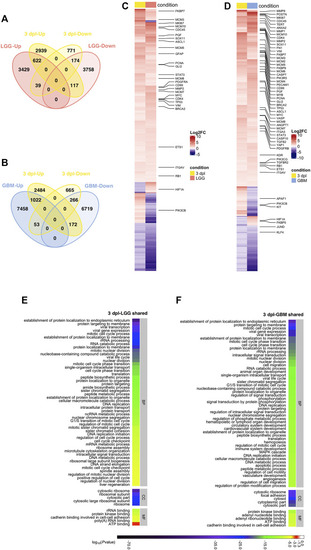
Early proliferative stage (3 dpl) of brain regeneration resembles brain cancer with regard to activation of cell proliferation. (A,B) Venn diagrams showing the number of upregulated (Up) or downregulated (Down) DEGs and the overlap between 3 dpl (yellow) and (A) LGG (pink) and (B) GBM (blue). (C,D) Heatmaps showing the expression of genes shared between 3 dpl (yellow) and (C) LGG (pink) and (D) GBM (blue). Each column represents a condition (3 dpl, LGG or GBM) and each row shows a single gene. The scale bar shows log2 fold changes from high to low regulation, represented by a color gradient from red to purple, respectively. (E,F) DAVID was used to show the most significantly enriched GO-BP (top 50), CC (top 5), and MF (top 5) terms based on transcriptional changes in comparison of 3 dpl with (E) LGG and (F) GBM by using human identifiers of shared DEGs. The heatmap scale shows log10 of the ease p-values for the most significantly enriched GO terms. dpl: days post-lesion, DAVID: database for Annotation, Visualization and Integrated Discovery, GO: Gene Ontology, BP: Biological Process, MF: Molecular Function, CC: Cellular Component, dpl: days post lesion, LGG: low-grade glioma, GBM: glioblastoma.

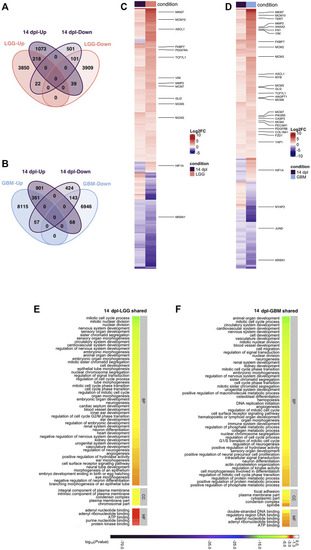
Differentiation stage (14 dpl) of brain regeneration and brain cancer share mechanisms related to developmental and morphogenetic processes. (A,B) Venn diagrams showing the number of upregulated (Up) or downregulated (Down) DEGs and the overlap between 14 dpl (purple) and (A) LGG (pink) and (B) GBM (blue). (C,D) Heatmaps showing the expression of genes shared between 14 dpl (purple), and (C) LGG (pink), and (D) GBM (blue). Each column represents a condition (14 dpl, LGG or GBM) and each row shows a single gene. The scale bar shows their log2 fold changes from high to low regulation, represented by a color gradient from red to purple, respectively. (E,F) DAVID was used to show the most significantly enriched GO-BP (top 50), CC (top 5), and MF (top 5) terms based on transcriptional changes in comparison of 14 dpl with (E) LGG and (F) GBM by using human identifiers of shared DEGs. The heatmap scale shows log10 of the ease p-values for the most significantly enriched GO terms. dpl: days post-lesion, DAVID: database for Annotation, Visualization and Integrated Discovery, GO: Gene Ontology, BP: Biological Process, MF: Molecular Function, CC: Cellular Component, dpl: days post lesion, LGG: low-grade glioma, GBM: glioblastoma.

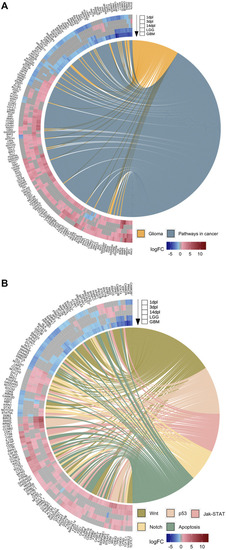
Early wound healing stage of brain regeneration is more similar to LGG and GBM than the proliferation and differentiation stages. (A,B) GOChord plots show log2 fold changes of the genes annotated in selected KEGG pathways (A) “Glioma” and “Pathways in cancer” and (B) “Wnt”, “p53”, “Jak-STAT”, “Notch” and “Apoptosis” for three stages of the zebrafish brain regeneration and two types of human brain cancers. The genes are linked to their assigned pathways by ribbons and ordered according to their log2 fold change values from high to low regulation, represented by a color gradient from blue to red, respectively. log2 fold changes are shown from the outer to the inner annulus in the following order: 1, 3, 14 dpl, LGG and GBM. An asterisk was appended to human genes associated as orthologs to several zebrafish genes in the list. dpl: days post-lesion, LGG: low-grade glioma, GBM: glioblastoma.

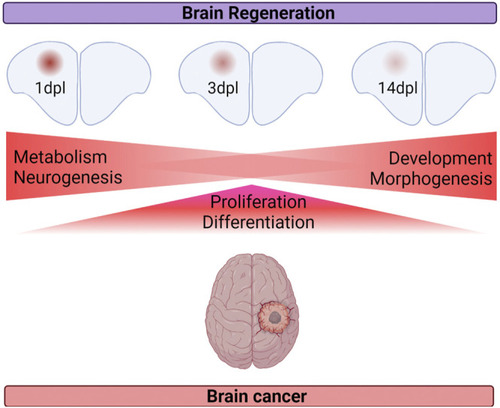
Summary of the shared cellular mechanisms between brain regeneration at three different stages of regeneration and brain cancer.

Acknowledgments
This image is the copyrighted work of the attributed author or publisher, and ZFIN has permission only to display this image to its users. Additional permissions should be obtained from the applicable author or publisher of the image. Full text @ Front Cell Dev Biol