IMAGE

FIGURE 1

ID
ZDB-IMAGE-220303-48
Source
Figures for Demirci et al., 2022
Image
Figure Caption

FIGURE 1

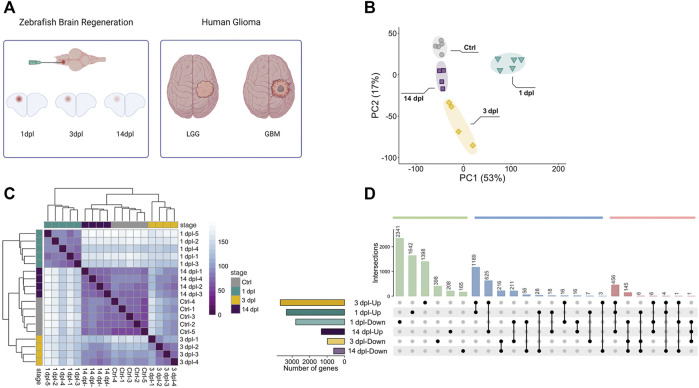
Sample preparation from three different stages of zebrafish brain regeneration and initial analyses of the transcriptome data. (A) Generation of the stab lesion and preparation of the RNA samples from lesioned hemispheres at 1, 3 and 14 dpl. Transcriptomes of the regenerating brain were compared to those of human adult LGG and GBM. (B) Principal component analysis (PCA) of three brain regeneration stages and their controls. Different colors of circle, square or rectangle dots represent the four groups of samples. Four or five dots with the same color refer to the biological replicates of a sample group. Four sample groups were well clustered among their replicates and well separated from other sample groups. (C) Sample-to-sample distance heatmap generated by using normalized counts for overall gene expression patterns for three stages of brain regeneration and control brain samples generated by the DESeq2 package. Different colors of dots represent the four groups of samples. (D) UpSet plot shows the comparison of DEG sets between regeneration stages. Total number of DEGs as Up or Down and time points are shown on x and y axes, respectively. Green bars represent the genes unique to a time point, blue bars the intersection of genes between two different time points and red bars the intersection of genes between three different time points. Black dots connected by lines correspond to the time point and Up/Down state. Numbers of overlapping genes are shown above each bar. dpl: days post-lesion, ctrl: control, LGG: low-grade glioma, GBM: glioblastoma, Up: upregulated, Down: downregulated.

Acknowledgments
This image is the copyrighted work of the attributed author or publisher, and ZFIN has permission only to display this image to its users. Additional permissions should be obtained from the applicable author or publisher of the image. Full text @ Front Cell Dev Biol