
- Title
-
Macrophage-Mediated Melanoma Reduction after HP-NAP Treatment in a Zebrafish Xenograft Model
- Authors
- Codolo, G., Facchinello, N., Papa, N., Bertocco, A., Coletta, S., Benna, C., Dall'Olmo, L., Mocellin, S., Tiso, N., de Bernard, M.
- Source
- Full text @ Int. J. Mol. Sci.

Effect of HP-NAP on melanoma growth in zebrafish model. (A) Scheme of the experimental design. M121224, RPMI-7951 or A375 human melanoma cells were stained with VybrantTM DiI, xenotransplanted into the yolk of transparent zebrafish larvae at 2 days post-fertilization (2 dpf)/0 days post-injection (0 dpi). At 4 dpf/2 dpi, embryos were injected with HP-NAP or saline (vehicle) as a negative control, and were observed at 9 dpf/7 dpi. (B,D,F) Representative fluorescence stereoscope images of embryos injected with M121224, RPMI-7951 and A375 cells respectively and treated with HP-NAP or vehicle. Arrowheads indicate metastases. Scale bar: 500 µm. (C,E,G) Scatter plots show the quantification of the tumor size (AU: Arbitrary Unit) at 9 dpf/7 dpi. Values are expressed as mean ± SEM and analyzed by Student’s t test; *, p < 0.05 and ***, p < 0.001; n = 7 for M121224 cells and n = 6 for RPMI-7951 and A375 cells (for each vehicle and HP-NAP treatment). |
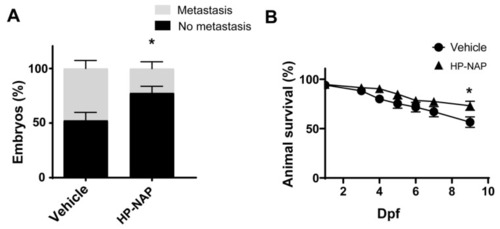
Effect of HP-NAP on melanoma metastasis and survival in zebrafish model. Fishes were treated as reported in Figure 1A. (A) The number of larvae with or without metastasis was counted at 9 dpf/7 dpi and expressed as percentage of the total embryos’ population. Values are expressed as mean ± SEM and analyzed by two-way ANOVA; *, p < 0.05; n = 150 fishes for each treatment. (B) Kaplan-Meier survival curves of animals treated with HP-NAP vs. vehicle; n = 50 fishes for each treatment. The Log Rank test was used for statistical analysis. *, p < 0.05. |
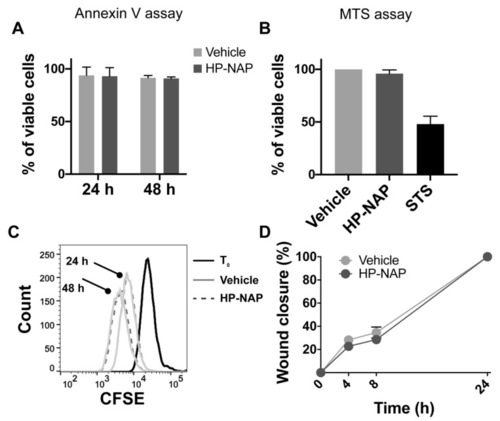
HP-NAP has no direct effect on melanoma cells. (A) M121224 cells were treated with HP-NAP or saline (vehicle) and after 24 and 48 h, apoptosis was evaluated by annexin V staining. (B) M121224 cells were treated with HP-NAP, saline (vehicle) or staurosporine (STS) as positive control; cytotoxicity was evaluated by MTS assay. Values are reported as percentage of viable cells ± SEM of three independent experiments. (C) M121224 cells were labeled with CSFE and treated with HP-NAP or saline (vehicle) for 24 and 48 h. Cells were harvested, washed, resuspended in saline and analyzed by flow cytometry. Representative histograms from two independent experiments are reported. (D) Cell migration was evaluated after a 24 h incubation with HP-NAP in serum-free RPMI (supplemented with 0.1% BSA). Cells incubated in medium with the same volume of saline were considered as control (vehicle). 0.1 × 10⁶ M121224 cells were seeded in a 24-well culture dish. Scratches were created once cells reached confluence. At time zero and after 4, 8 and 24 h, wound closures were photographed under a microscope. Migration rate was expressed as percentage of wound closure (0%: T0 after wound; 100%: completely repaired). |
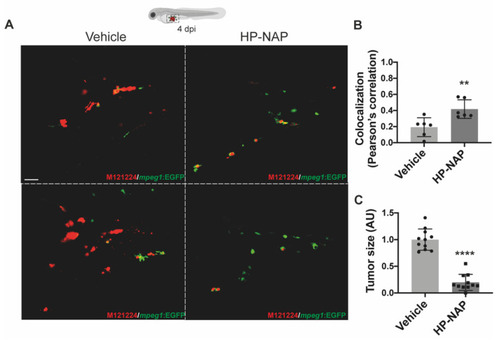
HP-NAP treatment favors the interaction between tumor cells and macrophages and early affects tumor size. Tg(mpeg1:EGFP)gl22 zebrafish embryos were xenotransplanted with M121224 melanoma cells (red), injected or not with HP-NAP at 2 dpi and observed at 4 dpi. (A) Representative 2D projections of confocal single plane images of the yolk-sac region of embryos at 4 dpi. Magnification: 40×. Scale bar: 20 µm. (B) Scatter plots show the colocalization (Pearson’s correlation) between green (macrophages) and red (tumor cells) signals in vehicle- and HP-NAP-injected fishes. At least 5 Regions of Interest (ROIs) per sample of 3 independent experiments were analyzed. Values are shown as mean ± SEM and analyzed by Student’s t test; **, p < 0.01; n = 6 for each condition. (C) Scatter plots show the quantification of the tumor size (AU: Arbitrary Unit) at 4 dpi. Values are expressed as mean ± SEM and analyzed by Student’s t test; ****, p < 0.0001; n = 11 for each condition, from 3 independent experiments. |

HP-NAP administration in zebrafish promotes the acquisition of a pro-inflammatory profile by macrophages. Tg(mpeg1:EGFP)gl22 zebrafish embryos were xenotransplanted with M121224 melanoma cells and treated with HP-NAP or saline (vehicle) at 2 dpi. After 24 h (3 dpi) macrophages were FACS-sorted and the expression of genes was evaluated by qRT-PCR. Data were normalized to the housekeeping gene 18S. The expression of each gene in macrophages isolated from HP-NAP-treated fishes was relative to that in macrophages isolated from vehicle animals, taken as reference and set as 1. Data are expressed as the mean ± SEM of 2 independent experiments and analyzed by Student’s t test; *, p < 0.05; ***, p < 0.001. |
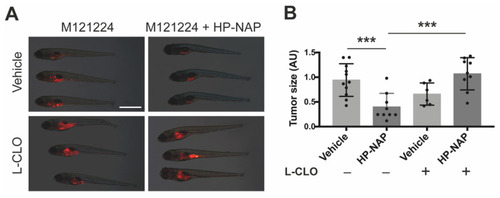
The anti-tumor activity of HP-NAP is strictly dependent on macrophages: effect of macrophage depletion by liposome-encapsulated clodronate (L-CLO). Tg(mpeg1:EGFP)gl22 zebrafish embryos were xenotransplanted with M121224 melanoma cells (red) and treated with empty liposomes + saline (vehicle), or empty liposomes + HP-NAP, L-CLO + saline (L-CLO) or L-CLO + HP-NAP at 2 dpi and observed at 4 dpi. (A) Representative fluorescence stereoscope images of the total tumor mass in fishes at 4 dpi. Scale bar: 1 mm. (B) Scatter plots show the quantification of the total tumor size (AU: Arbitrary Unit) at 4 dpi. Values are expressed as mean ± SEM and analyzed by one-way ANOVA; ***, p < 0.001, HP-NAP (n = 9) vs. vehicle (n = 11) and L-CLO + HP-NAP (n = 9) vs. HP-NAP (n = 11). |
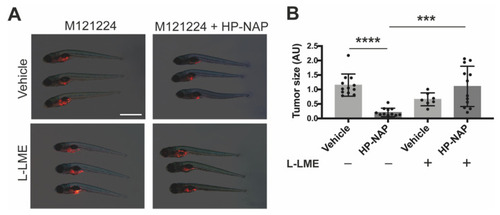
The anti-tumor activity of HP-NAP is strictly dependent on macrophages: effect of macrophage depletion by L-Leucyl L-Leucine Methyl Esther (L-LME). Tg(mpeg1:EGFP)gl22 zebrafish embryos were xenotransplanted with M121224 melanoma cells (red) and treated with saline (vehicle), or L-leucine methyl ester (L-LME), L-LME + HP-NAP or HP-NAP at 2 dpi and observed at 4 dpi. (A) Representative fluorescence stereoscope images of the total tumor mass in fishes at 4 dpi. Scale bar, 1 mm. (B) Scatter plots show the quantification of the total tumor size (AU: Arbitrary Unit) at 4 dpi. Values are expressed as mean ± SEM and analyzed by one-way ANOVA; ****, p < 0.0001, HP-NAP vs. vehicle (n = 12 for each condition); ***, p < 0.01: L-LME + HP-NAP (n = 12) vs. HP-NAP (n = 12). |