
- Title
-
SIX1 reprograms myogenic transcription factors to maintain the rhabdomyosarcoma undifferentiated state
- Authors
- Hsu, J.Y., Danis, E.P., Nance, S., O'Brien, J.H., Gustafson, A.L., Wessells, V.M., Goodspeed, A.E., Talbot, J.C., Amacher, S.L., Jedlicka, P., Black, J.C., Costello, J.C., Durbin, A.D., Artinger, K.B., Ford, H.L.
- Source
- Full text @ Cell Rep.
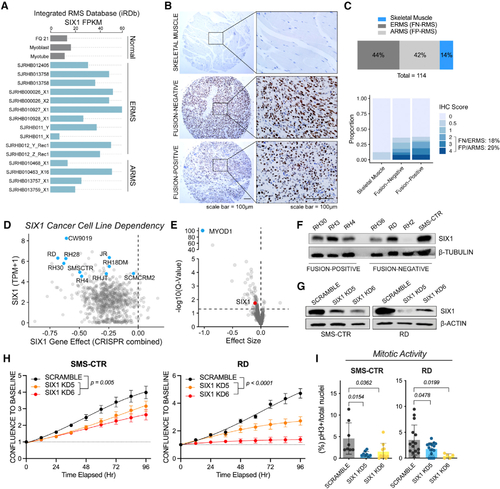
SIX1 is overexpressed and predicted to be an essential gene in RMS
(A) Fragments per kilobase million (FPKM) for SIX1 in the St. Jude Pediatric Cancer Genome Project cohort (gray, normal skeletal muscle controls; FQ21, fetal quadriceps muscle). (B) IHC staining (DAB) for SIX1 on an RMS tissue array containing normal skeletal muscle controls. The array was counterstained with hematoxylin. (C) Distribution of samples on the RMS and skeletal muscle tissue arrays (top) and distribution of IHC scores (bottom). (D) SIX1 transcripts per kilobase million (TPM) plotted against the SIX1 gene effect score in 1,775 cell lines in the Cancer Dependency Map CRISPR-Cas9 KO screen (blue dots, RMS). (E) Volcano plot of gene dependency scores for MYOD1 (blue) and SIX1 (red) in RMS cell lines versus all other cell lines. Statistical analysis was performed using a two-class Kolmogorov-Smirnov test. (F) Western blot analysis of SIX1 across a panel of FN and FP RMS human cell lines. (G) Western blot analysis of SIX1 KD in RD and SMS-CTR cell lines. Representative KDs are shown. (H) IncuCyte live-cell imaging growth assays of SMS-CTR and RD Scramble and SIX1 KD cells over 96 h. Cells were plated in triplicate, and relative cell growth was measured by normalizing confluency at each time point relative to initial confluency. Data represent mean ± SD from one representative experiment at each time point, and statistical differences between Scramble and SIX1 KD5 or KD6 were measured by fitting data to a longitudinal mixed-effects model. (I) Mitotic activity of SMS-CTR and RD Scramble and SIX1 KD cells measured by pH3 staining and DAPI counterstaining; each dot represents data from one independent experiment. |
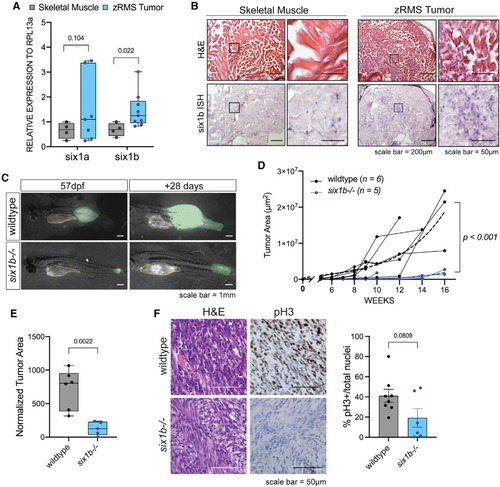
six1b is required for zebrafish RMS growth
(A) Quantitative real-time PCR for six1a and six1b in dissected GFP+ zRMS tissue compared with age-matched normal skeletal muscle (n = 4 normal muscle samples, n = 6 zRMS samples). (B) Representative images of six1b transcripts as visualized by H&E and ISH (n = 5 fish per group). (C) Representative images of tumor progression (colored in green) from 57–85 dpf in wild-type and six1b−/− siblings. The yellow outline represents autofluorescence from the stomach. (D)Quantification of GFP+ tumor area in each fish over time. Tumor growth is represented as individual tracks. Composite growth of wild-type and six1b−/− tumors was fitted to a non-linear logistical growth model and is represented by dotted lines. A longitudinal mixed-effects model was used to measure statistical differences. (E) Tumor area normalized to standard length of fish at 120 dpf or earlier time points because of moribundity. Statistical differences were calculated using Welch’s t test. (F) Representative staining and quantification of H&E and pH3 IHC in sectioned zRMS tumors. Dots in the graph represent the percentage of pH3 staining/tumor section; staining was quantified over 2 sections/tumor (n = 4 wild-type [WT] tumors, n = 3 six1b−/− tumors). Statistical differences were calculated using Welch’s t test. |
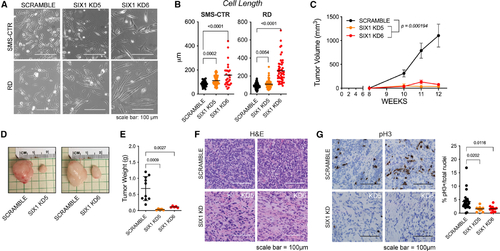
SIX1 KD inhibits human RMS growth and progression
(A and B) Bright-field images depicting the elongated cell morphology of SIX1 KD SMS-CTR and RD cells (A) and quantification of cell length (B). Statistical differences were calculated using one-way ANOVA followed by Dunnett’s multiple comparisons post hoc test. (C) Tumor volumes, measured by caliper, over 12-weeks for Scramble and SIX1 KD SMS-CTR cells that were engrafted into the flanks of NSG mice. Data were fitted to a longitudinal mixed-effects model for statistical analysis of Scramble and SIX1 KD samples. Error bars represent mean ± SD at each time point. (D) Representative images of dissected Scramble or SIX1 KD xenografted tumors at 12 weeks. (E) Final tumor weights in grams at the end of the study (n = 10 mice total). Statistical differences were calculated using one-way ANOVA followed by Dunnett’s multiple comparisons post hoc test. (F) Representative H&E histology of dissected Scramble and SIX1 KD xenografted tumors (n = 5 tumors/KD). (G) Representative pH3 immunostaining (brown) of dissected Scramble and SIX1 KD xenografted tumors. Dots in the graph represent the percentage of pH3+ cells per tumor section; pH3 staining was quantified over 2 sections per tumor. Statistical differences were calculated using one-way ANOVA followed by Dunnett’s multiple comparisons post hoc test. |
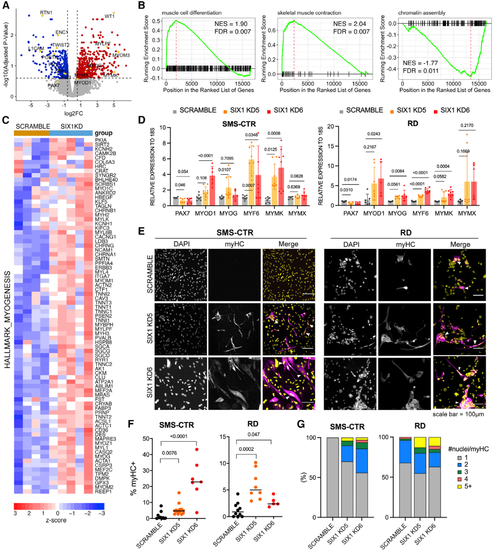
SIX1 KD induces myogenic differentiation in RMS cells
(A) Volcano plot of log2 fold change (log2FC) gene expression (SIX1 KD over Scramble) and adjusted p value after differential expression analysis from SMS-CTR RNA-seq. Red and blue dots denote genes significantly upregulated and downregulated upon SIX1 KD, respectively. (B) GSEA plots of ranked log2FC expression (SIX1 KD over Scramble) show positive enrichment for curated muscle cell differentiation and skeletal muscle contraction gene signatures and negative enrichment for chromatin assembly gene signatures. (C) Heatmap expression of the Molecular Signatures DataBase (MSigDB) myogenesis gene set across Scramble and SIX1 KD samples. Scale bar represents Z score-converted log2CPM values. (D) qRT-PCR of genes involved in muscle differentiation in SMS-CTR and RD cell lines with SIX1 KD. Each dot represents one independent biological replicate. Statistical differences were calculated using one-way ANOVA followed by post hoc Dunnett’s multiple comparisons test. (E) MyHC (magenta) immunostaining and DAPI counterstain (yellow) in SIX1 KD RMS cells compared with Scramble RMS cells. (F) Quantification of myHC staining over total nuclei per field of view; each dot represents the percentage of myHC+ cells over one technical replicate from at least 3 independent experiments. (G)Fusion indices of SMS-CTR and RD control and SIX1 KD cells. Statistical differences were calculated by one-way ANOVA followed by Dunnett’s multiple comparisons post hoc test. |
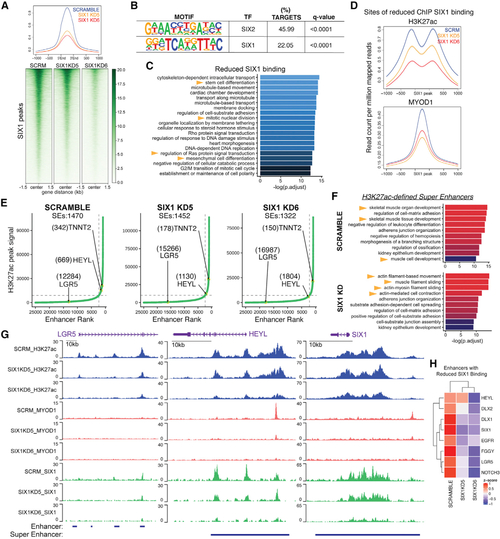
SIX1 globally regulates stem/oncogenic and myogenic differentiation genes through fine-tuning of SE activity
(A) Heatmaps and average profiles of genome-wide SIX1 ChIP-seq signals in SMS-CTR Scramble and SIX1 KD5 and KD6 cells, centered at Scramble SIX1 peaks. (B) Motif analysis of peak coordinates exhibiting 1.5-fold reduced SIX1 binding in SIX1 KD5 and KD6 SMS-CTR SIX1 ChIP-seq datasets. The top 2 enriched motifs are shown. (C)Pathway enrichment of annotated sites of SIX1 loss in SIX1 KD5 and KD6 lines. (D)Average profiles of MYOD1 and H3K27ac ChIP signal over loci that exhibited 1.5-fold reduced SIX1 binding in SIX1 KD cells compared with Scramble cells. (E) ROSE analysis performed on Scramble and SIX1 KD H3K27ac peaks shows a shift in HEYL (down) and TNNT2/TNNI1 (up) superenhancer (SE) rank between Scramble and SIX1 KD cells. Ranks of SEs are labeled in parentheses next to the annotated SE. (F) Pathway enrichment of genes associated with SEs identified in Scramble and the union of SEs identified in SIX1 KD5 and KD6 (SIX1 KD) cells. (G) H3K27ac, MYOD1, and SIX1 ChIP signal over the LGR5, HEYL, and SIX1 enhancers. (H) CPM expression of example SE-regulated genes with known stem cell functions that exhibited at least 1.5-fold SIX1 reduced binding, taken from RNA-seq comparing SCRM and SIX1 KD cells. |
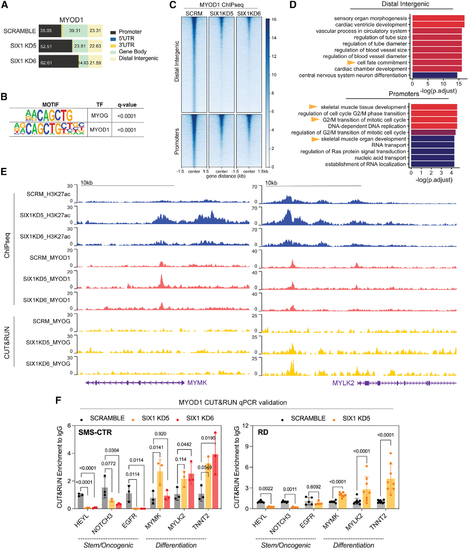
SIX1 loss alters MYOD1 occupancy at muscle differentiation and stem/oncogenic loci
(A) Peak distribution of the MYOD1 TF in SMS-CTR Scramble and SIX1 KD5 and KD6 cells across promoters (±2.5 kb from annotated TSSs), 5ʹ/3ʹ UTR, gene body (which includes intronic and exonic regions), and distal intergenic/enhancer regions. (B) Motif analysis of overlapping macs2 MYOD1 peak coordinates; the top 2 motifs are shown. (C) Heatmaps of MYOD1 signal at annotated MYOD1-bound distal intergenic and promoter regions. (D) Pathway enrichment of distal intergenic and promoter-bound MYOD1 peaks. (E) H3K27ac, MYOD1, and MYOG tracks over the MYMK and MYLK2 loci in SIX1 KD and Scramble SMS-CTR cells. (F) C&R quantitative real-time PCR validation of changes in MYOD1 binding at stem/oncogenic and myogenic differentiation genes that occur in SMS-CTR and RD SIX1 KD cells. Statistical differences for each loci were measured using one-way ANOVA followed by post hoc Dunnett’s multiple comparisons test. |
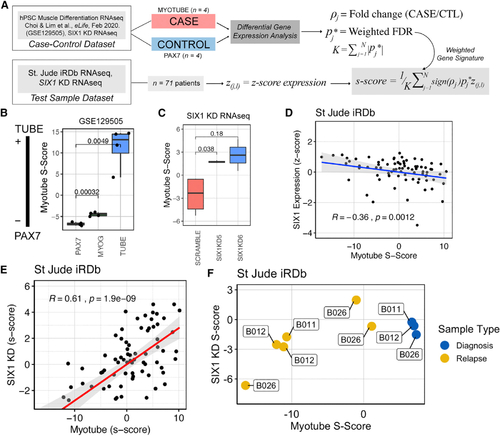
SIX1 expression in RMS patients is inversely correlated with a myotube gene signature
(A) Overview of the S scoring methodology, where gene expression in the case-control data is used to generate a weighted gene signature to score test sample transcriptomes on a continuous scale. (B) Myotube S scores for samples used in the training set plotted as proof of concept that the myotube S score can quantify myogenic differentiation status. Statistical differences were measured by Student’s t test. (C) Myotube S scoring methodology applied to the SIX1 KD RNA-seq dataset, demonstrating that SIX1 KD cells are more advanced in the myogenic lineage than Scramble cells. Statistical differences were measured by Student’s t test. (D) Scatterplot of myotube S scores plotted against SIX1 Z score-converted expression and Spearman rank correlation coefficient show a moderate inverse correlation between differentiation status and SIX1 expression in St. Jude RMS samples (n = 71). (E) Scatterplot of SIX1 KD S scores derived from SIX1 KD RNA-seq data against myotube S score shows a strong positive correlation between the SIX1 KD and myotube gene signatures in the St. Jude RMS dataset. (F) Myotube and SIX1 KD S scores of three individuals, with biopsies collected at multiple stages of disease. |