
|
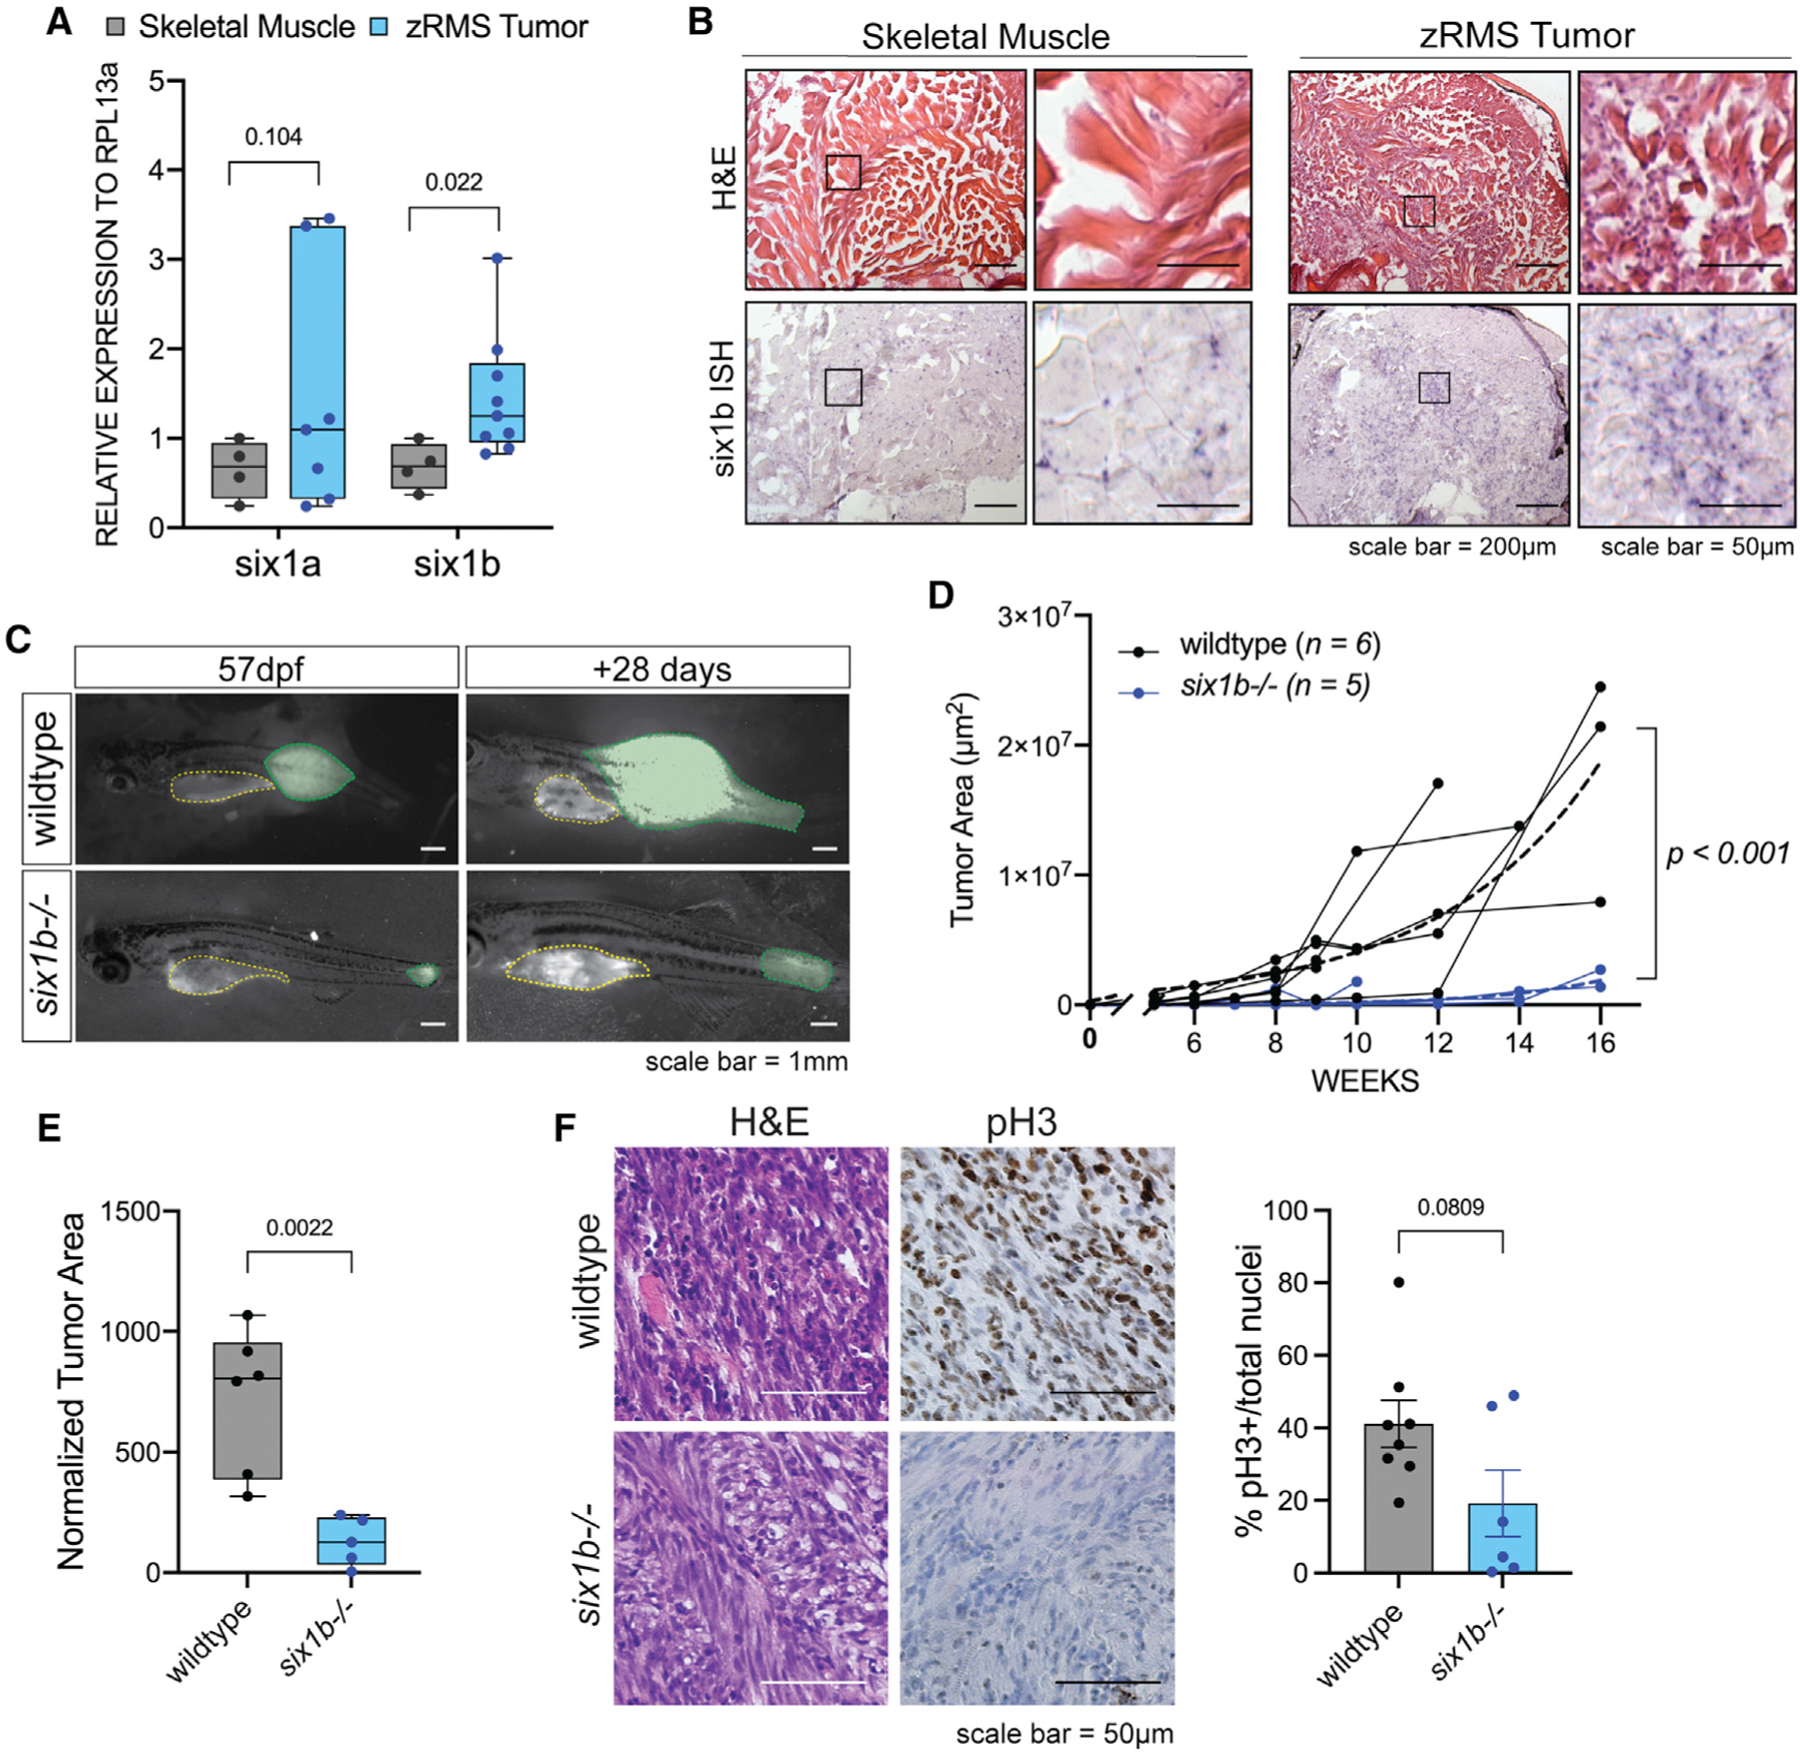
Fig. 2
(A) Quantitative real-time PCR for six1a and six1b in dissected GFP+ zRMS tissue compared with age-matched normal skeletal muscle (n = 4 normal muscle samples, n = 6 zRMS samples).
(B) Representative images of six1b transcripts as visualized by H&E and ISH (n = 5 fish per group).
(C) Representative images of tumor progression (colored in green) from 57–85 dpf in wild-type and six1b−/− siblings. The yellow outline represents autofluorescence from the stomach.
(D)Quantification of GFP+ tumor area in each fish over time. Tumor growth is represented as individual tracks. Composite growth of wild-type and six1b−/− tumors was fitted to a non-linear logistical growth model and is represented by dotted lines. A longitudinal mixed-effects model was used to measure statistical differences.
(E) Tumor area normalized to standard length of fish at 120 dpf or earlier time points because of moribundity. Statistical differences were calculated using Welch’s t test.
(F) Representative staining and quantification of H&E and pH3 IHC in sectioned zRMS tumors. Dots in the graph represent the percentage of pH3 staining/tumor section; staining was quantified over 2 sections/tumor (n = 4 wild-type [WT] tumors, n = 3 six1b−/− tumors). Statistical differences were calculated using Welch’s t test.