
|
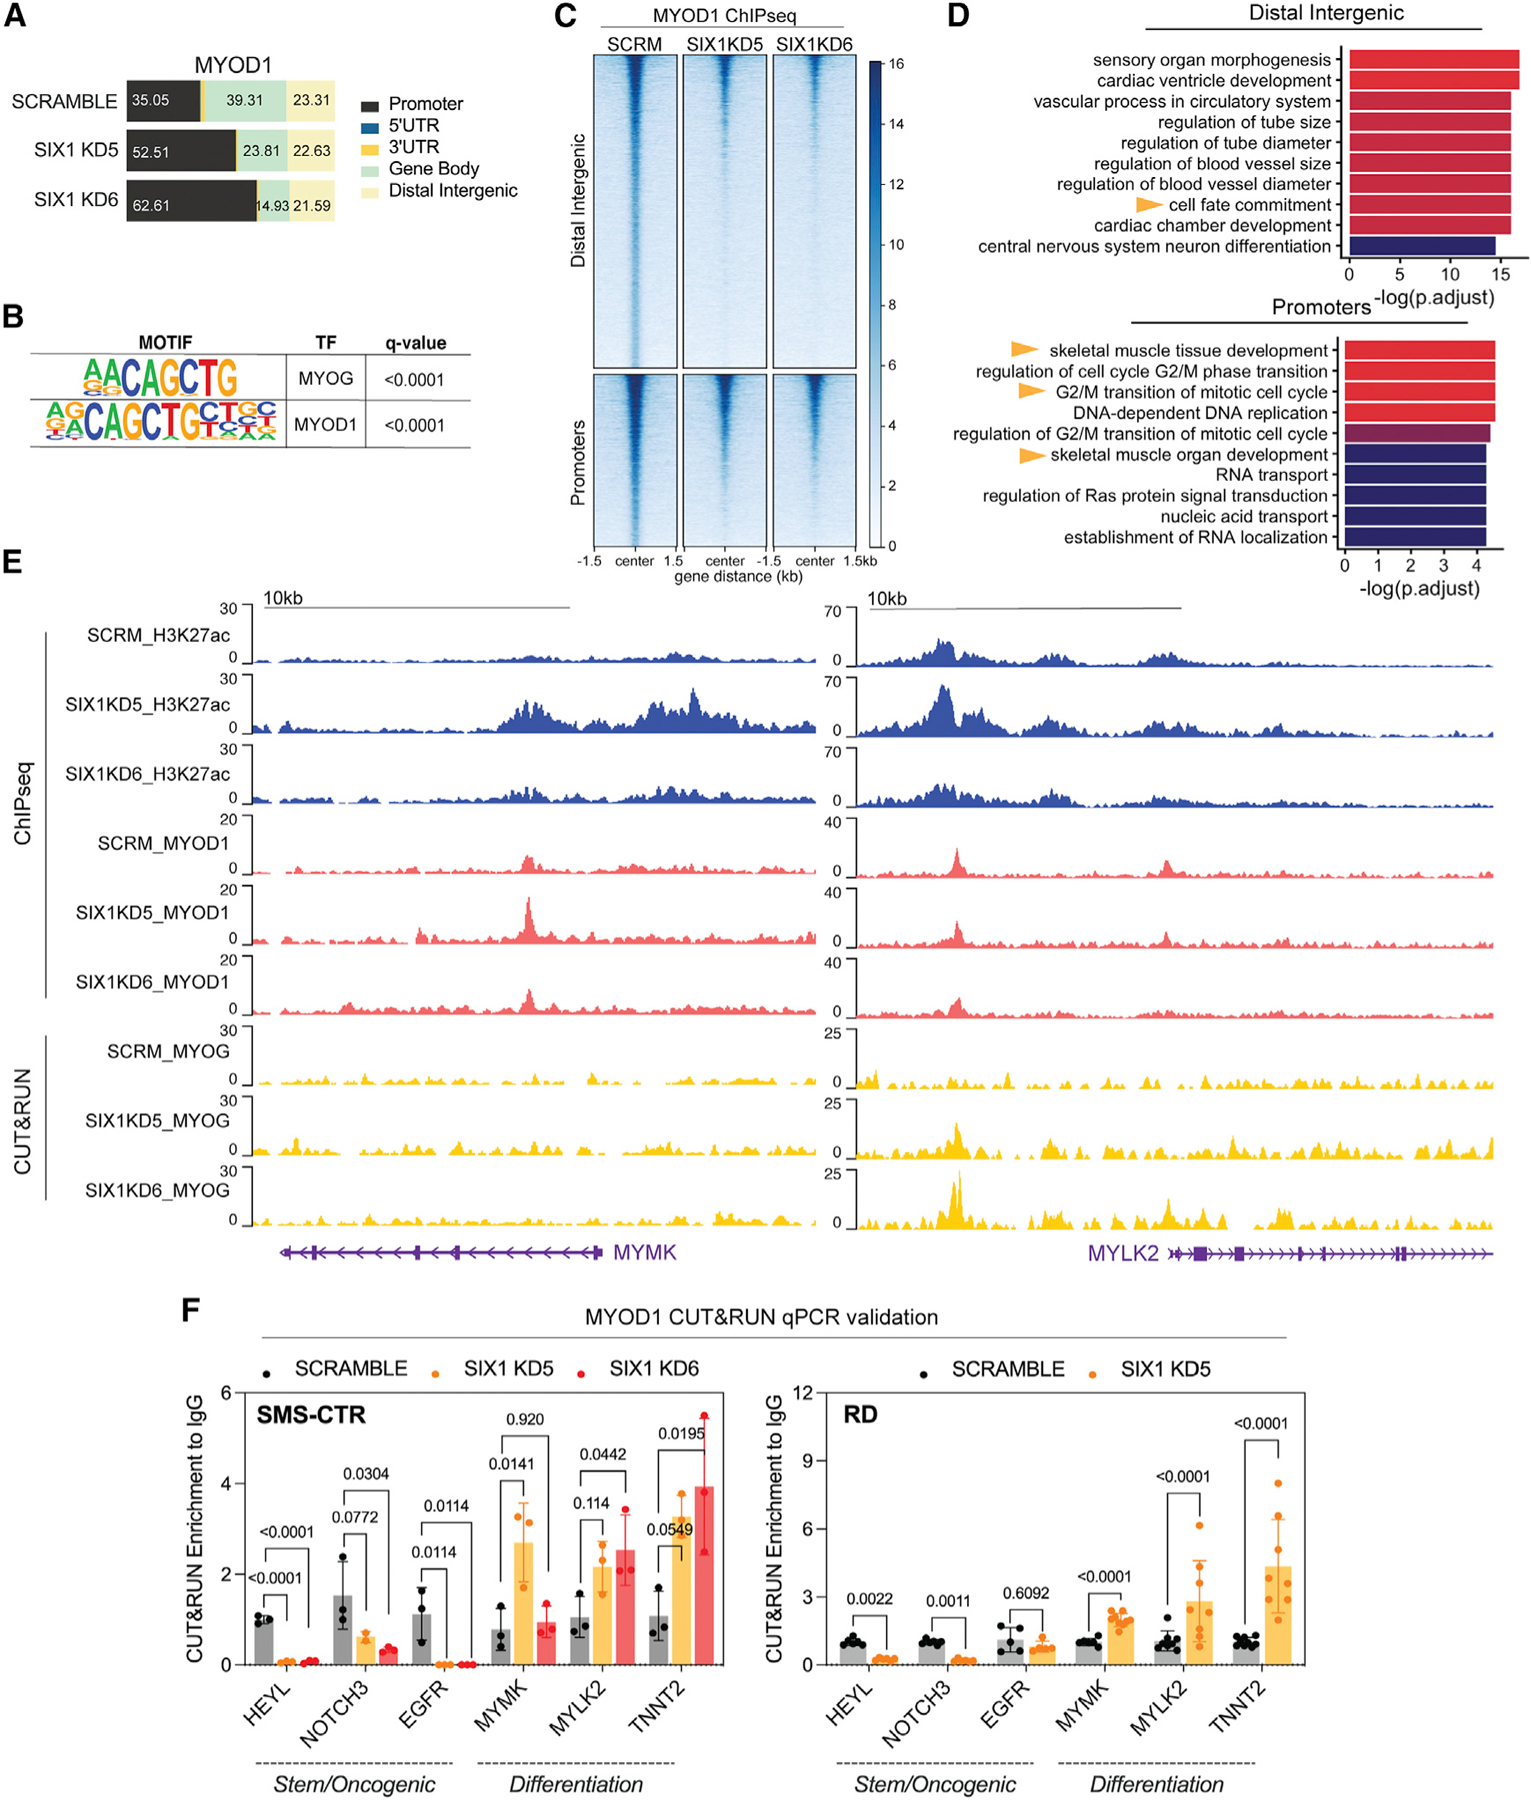
Fig. 6
(A) Peak distribution of the MYOD1 TF in SMS-CTR Scramble and SIX1 KD5 and KD6 cells across promoters (±2.5 kb from annotated TSSs), 5ʹ/3ʹ UTR, gene body (which includes intronic and exonic regions), and distal intergenic/enhancer regions.
(B) Motif analysis of overlapping macs2 MYOD1 peak coordinates; the top 2 motifs are shown.
(C) Heatmaps of MYOD1 signal at annotated MYOD1-bound distal intergenic and promoter regions.
(D) Pathway enrichment of distal intergenic and promoter-bound MYOD1 peaks.
(E) H3K27ac, MYOD1, and MYOG tracks over the MYMK and MYLK2 loci in SIX1 KD and Scramble SMS-CTR cells.
(F) C&R quantitative real-time PCR validation of changes in MYOD1 binding at stem/oncogenic and myogenic differentiation genes that occur in SMS-CTR and RD SIX1 KD cells. Statistical differences for each loci were measured using one-way ANOVA followed by post hoc Dunnett’s multiple comparisons test.