
|
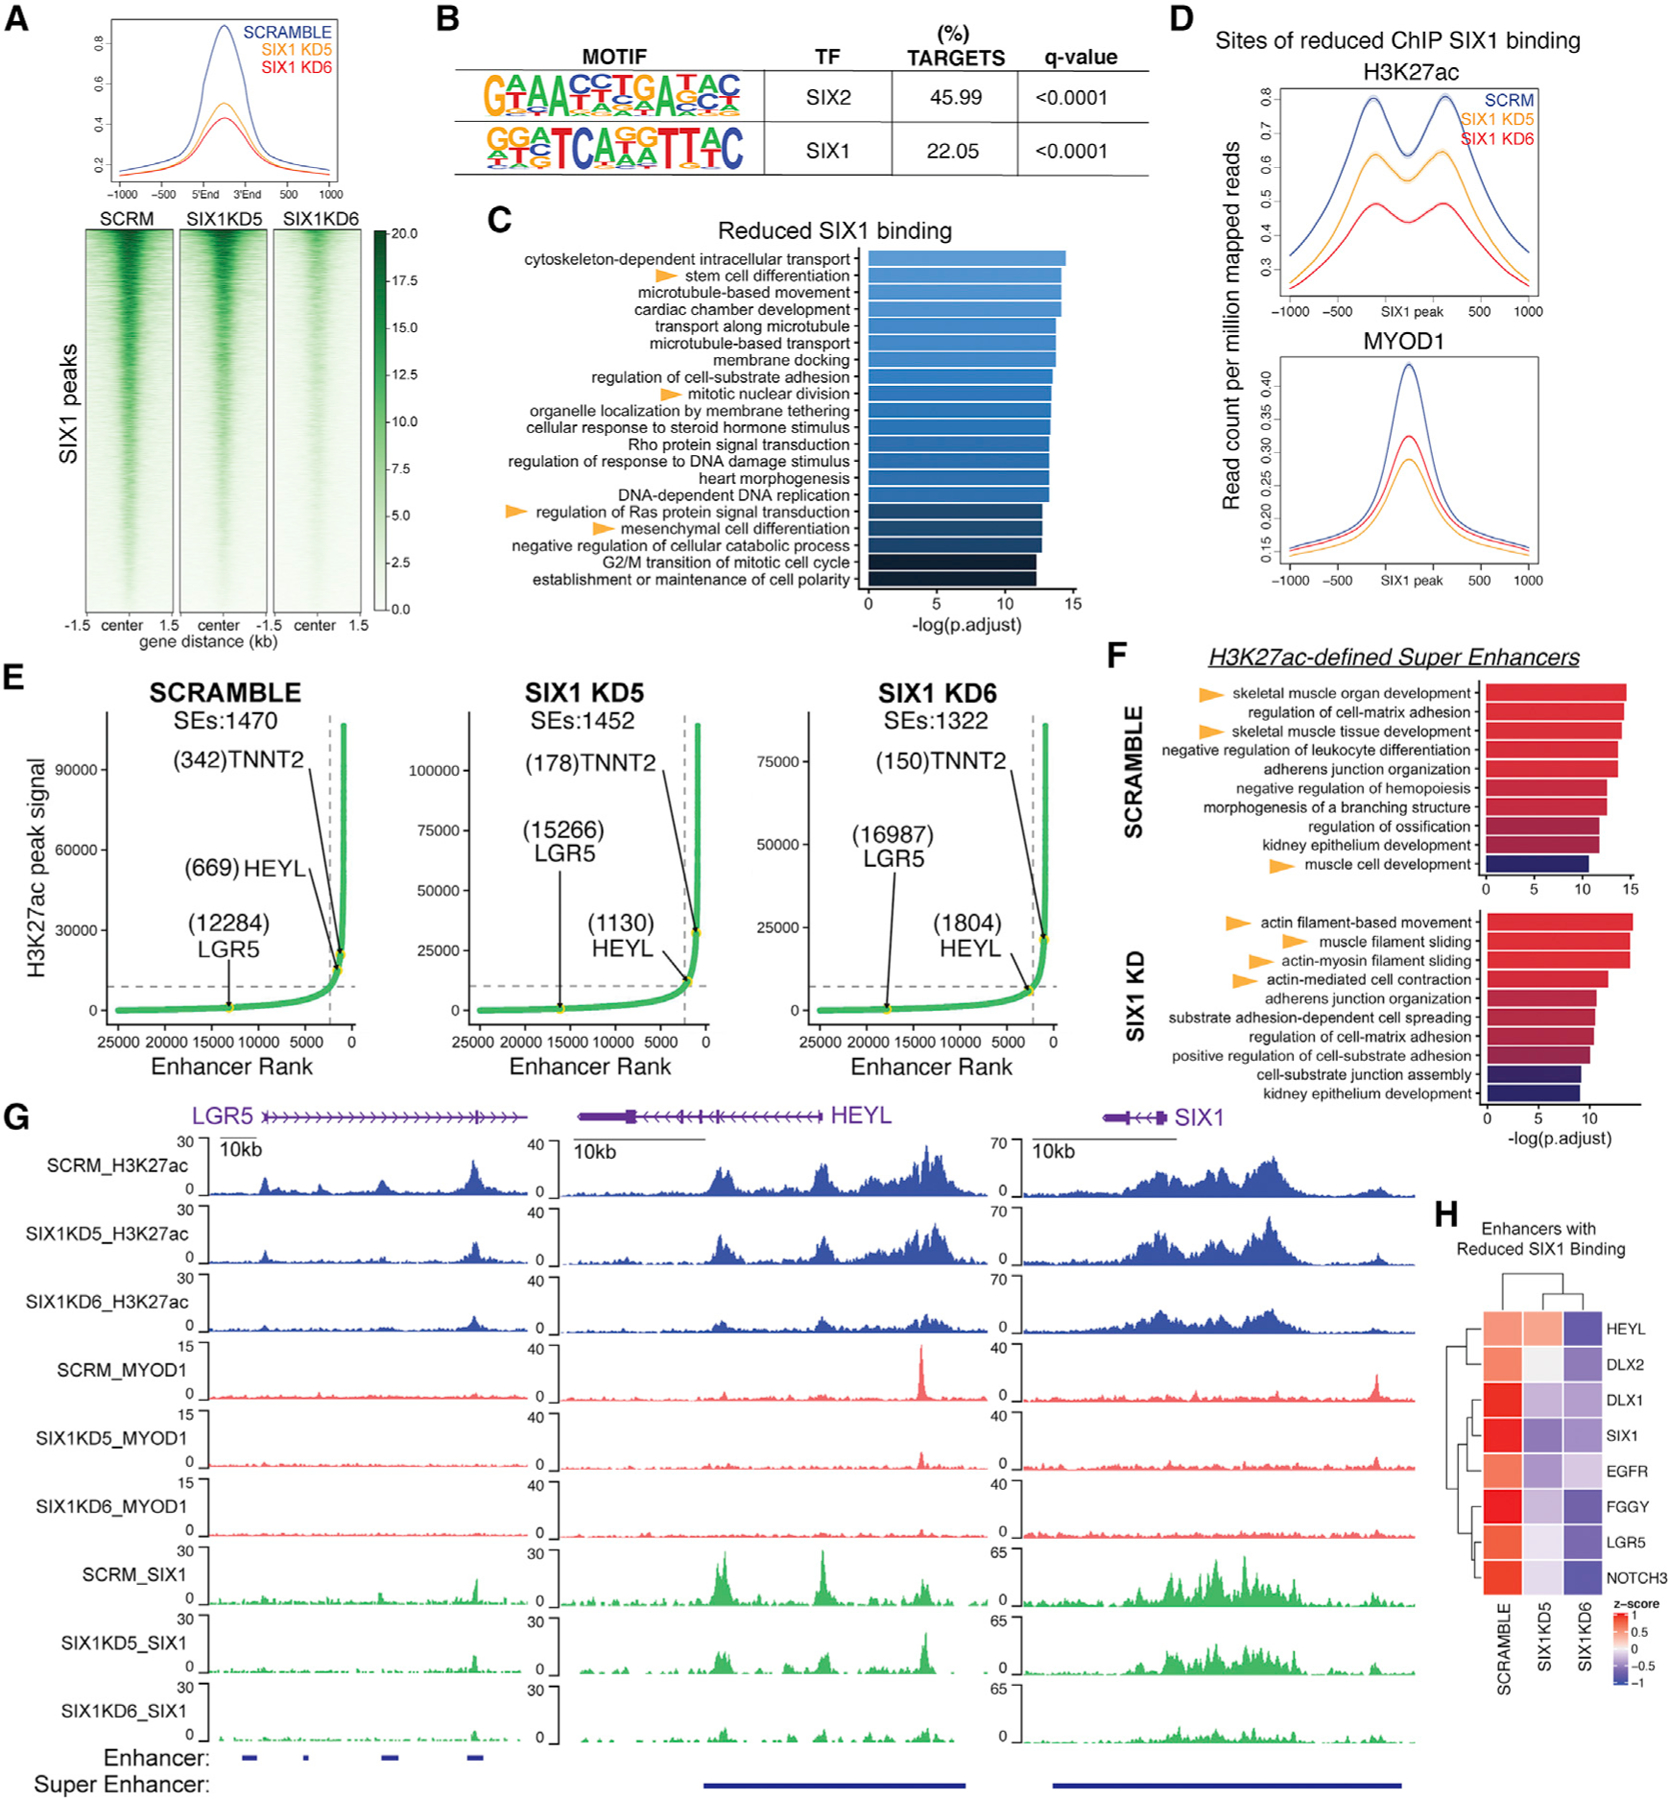
Fig. 5
(A) Heatmaps and average profiles of genome-wide SIX1 ChIP-seq signals in SMS-CTR Scramble and SIX1 KD5 and KD6 cells, centered at Scramble SIX1 peaks.
(B) Motif analysis of peak coordinates exhibiting 1.5-fold reduced SIX1 binding in SIX1 KD5 and KD6 SMS-CTR SIX1 ChIP-seq datasets. The top 2 enriched motifs are shown.
(C)Pathway enrichment of annotated sites of SIX1 loss in SIX1 KD5 and KD6 lines.
(D)Average profiles of MYOD1 and H3K27ac ChIP signal over loci that exhibited 1.5-fold reduced SIX1 binding in SIX1 KD cells compared with Scramble cells.
(E) ROSE analysis performed on Scramble and SIX1 KD H3K27ac peaks shows a shift in HEYL (down) and TNNT2/TNNI1 (up) superenhancer (SE) rank between Scramble and SIX1 KD cells. Ranks of SEs are labeled in parentheses next to the annotated SE.
(F) Pathway enrichment of genes associated with SEs identified in Scramble and the union of SEs identified in SIX1 KD5 and KD6 (SIX1 KD) cells.
(G) H3K27ac, MYOD1, and SIX1 ChIP signal over the LGR5, HEYL, and SIX1 enhancers.
(H) CPM expression of example SE-regulated genes with known stem cell functions that exhibited at least 1.5-fold SIX1 reduced binding, taken from RNA-seq comparing SCRM and SIX1 KD cells.