FIGURE SUMMARY
Title

Radiation dose enhancement using gold nanoparticles with a diamond linear accelerator target: a multiple cell type analysis

Authors
Piccolo, O., Lincoln, J.D., Melong, N., Orr, B.C., Fernandez, N.R., Borsavage, J., Berman, J.N., Robar, J., Ha, M.N.
Source
Full text @ Sci. Rep.

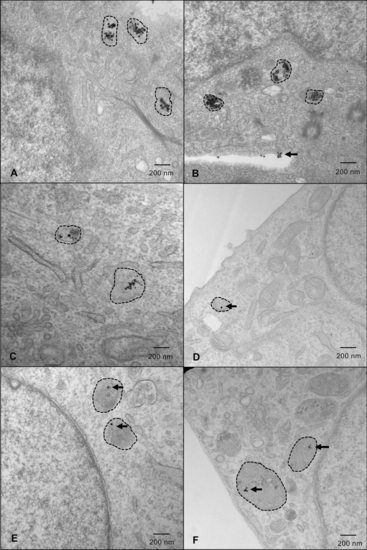
HNC cells demonstrate the greatest uptake of GNPs in lysosomes. Representative images of cells labelled with 25 µM GNPs. Lysosomes are indicated with hashed outlines. (a) FaDu; (b) HSC-3; (c) Detroit-562; (d) SK-N-AS; (e) Panc1; and (f) A673 cells. Cells were fixed approximately 36 h after GNP-labelling (approximate radiation timepoint) and images were captured by a transmission electron microscope. Imaging was done in triplicate—5 images were captured for each sample, with 3 samples/replicate, and 3 replicates in total. HNC head and neck cancer, GNPs gold nanoparticles.

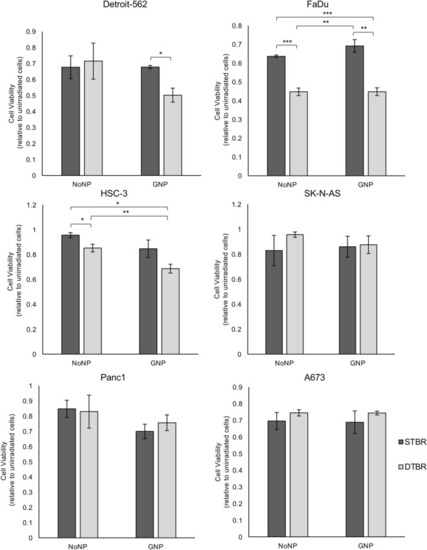
GNP-labeled HNCCs irradiated with the DTB show reduced viability 3 days post-irradiation. The alamarBlue viability assay was used to determine the levels of oxidative phosphorylation in cells irradiated with the STB or DTB and labelled with GNPs or NoNPs, 3 days after radiation. Detroit-562, FaDu, and HSC-3 HNCC lines demonstrated a significant reduction in cell viability following 8 Gy irradiation with the DTB in cells labelled with GNP compared to NoNP-labelled cells with STBR (p = 0.018, p = 0.004, p = 0.003, respectively). NoNP FaDu cells irradiated with the DTB demonstrated decreased viability compared to NoNP and GNP cells with STBR (p = 0.001 and p = 0.003, respectively). Similarly, NoNP HSC-3 cells irradiated with the DTB demonstrated a reduction in viability compared to NoNP cells with STBR (p = 0.049). With DTBR, GNP-labelled HSC-3 cells decreased compared to NoNP cells (p = 0.024). SK-N-AS cells, Panc1 cells, and A673 cells demonstrated no significant differences in viability. Cell viability values are made relative to control cells that were not irradiated and are presented as the fold change means ± standard error of the mean, p* < 0.05, p** < 0.01, p*** < 0.001 for significant decrease in cell viability. Significance between groups was tested using one-way analysis of variance (ANOVA) with a Tukey multiple comparisons test (n = 3; 10 wells per group/replicate). GNP gold nanoparticles, NoNP no nanoparticles, HNCC head and neck cancer cells, STB(R) standard target beam (radiation), DTB(R) diamond target beam (radiation).

HNCCs labelled with GNPs show decreased in vitro colony forming potential 10 days post radiation. A colony formation assay (CFA) was used to determine the potential of GNP-labelled or unlabelled (NoNP) cancer cells to form colonies 10 days after radiation with the STB or DTB. (a) GNP-labeled Detroit-562 and FaDu cells irradiated with the DTB exhibit decreased colony formation potential compared to NoNP-labeled cells with STBR (both p = 0.045). With DTBR, GNP-labeled Detroit-562 cells formed fewer colonies than NoNP-labeled cells (p = 0.0001). GNP-labeled FaDu cells also demonstrated decreased colony forming potential with DTBR compared to STBR (p = 0.017). GNP-labelled HSC-3 cells formed fewer colonies with both DTB and STB radiation compared to unlabeled (NoNP) cells treated with DTBR (p = 0.025 and p = 0.045, respectively). Lastly, with NoNPs, STBR treated Detroit-562 cells formed fewer colonies than cells with DTBR (p = 0.0001). Panc1 cells exhibited a similar trend in the reduction of colonies in GNP-labeled groups with DTBR compared to other treatment groups, but the results were not significant. (b) Representative bright-field images of GNP-labeled HSC-3 cells fixed and stained with Crystal Violet in Petri plates receiving no radiation (No RT), STBR or DTBR. Results are presented as the fold change of surviving fraction (SF) means ± standard error of the mean, SF = (# of colonies/(plating efficiency (PE) × # of colonies seeded)) × 100. Fold changes were made relative to unirradiated control cells, p* < 0.05, p** < 0.01, p*** < 0.001 for significant decreases in colony forming potential. Significance between groups was tested using one-way analysis of variance (ANOVA) with a Tukey multiple comparisons test (n = 3). GNP gold nanoparticles, NoNP no nanoparticles, HNCC head and neck cancer cells, STB(R) standard target beam (radiation), DTB(R) diamond target beam (radiation).

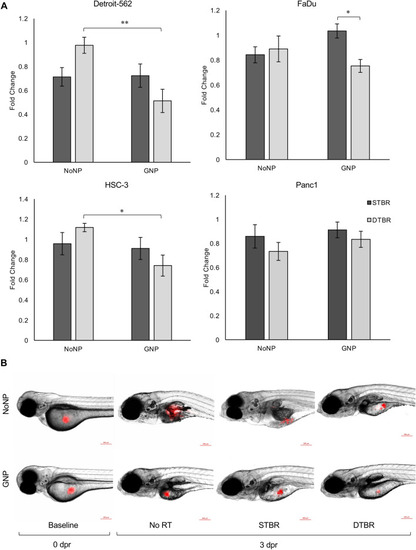
GNP-mediated DTBR significantly decreased HNCC proliferation in vivo. Groups of 15–20 zebrafish larvae were used for each time point and treatment group, 50–100 cells were injected into the yolk sac of each fish, and the number of fluorescent cells was quantified ex vivo. Xenografted cells were quantified at baseline (0 days post radiation (dpr)) and 3 dpr after treatment with 8 Gy from the STB or DTB. Results are represented as fold change of the unirradiated control cells (No RT). (a) With GNP-DTBR, Detroit-562 and HSC-3 xenografted cells demonstrate increased cell death compared to NoNP-DTBR (p = 0.005 and p = 0.015, respectively), and FaDu cells exhibit increased cell death compared to GNP-STBR (p = 0.022). There were no significant differences in Panc1 cancer cell proliferation between treatment groups in vivo. (b) Representative images of fluorescently labelled HSC-3 HNCCs injected into the yolk sac of casper larvae, scale bars are 200 µM. Results are presented as fold change means ± standard error of the mean, p* < 0.05, p** < 0.01, p*** < 0.001 for significant decreases in in vivo cell proliferation. Significance between groups was tested using one-way analysis of variance (ANOVA) with a Tukey multiple comparisons test (n = 3; 20 larvae per group/replicate). GNP gold nanoparticles, NoNP no nanoparticles, HNCC head and neck cancer cells, STB(R) standard target beam (radiation), DTB(R) diamond target beam (radiation).

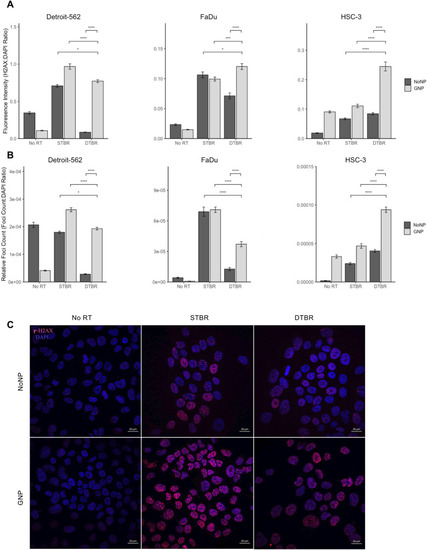
GNP labelled Detroit-562 and HSC-3 HNCCs demonstrate increased fluorescence intensity (FI) of double stranded breaks (DSBs) with DTBR compared to NoNP cells with STBR. Cells were cultured in 6-well plates, irradiated with 8 Gy from the STB or DTB, then fixed 30 min after radiation. Cells were processed for immunohistochemistry (IHC) with γ-H2AX to assess DNA double strand breaks and DAPI nuclear stain. (a) The FI of γ-H2AX foci was determined and measured relative to the FI of DAPI nuclear stain within each nucleus. GNP-labeled Detroit-562 and HSC-3 cells that received DTBR demonstrated increased FI of γ-H2AX foci than No NP cells with STBR (p = 0.049 and p < 0.0001, respectively). With DTBR, Detroit-562, FaDu, and HSC-3 GNP-labeled cells demonstrated greater FI of γ-H2AX foci compared to No NPs (p < 0.0001 for all). GNP-labeled FaDu and HSC-3 cells exhibited increased FI with DTBR compared to STBR (p = 0.001 and p < 0.0001, respectively), but GNP-labeled Detroit-562 cells displayed decreased FI with DTBR compared to STBR (p < 0.0001). (b) The number of γ-H2AX foci was analysed and made relative to the nuclear area. With DTBR, GNP-labeled Detroit-562, FaDu, and HSC-3 cells exhibited significantly greater foci/nucleus than No NP cells (p < 0.0001, p < 0.0001, and p < 0.001, respectively). GNP-labeled Detroit-562 and HSC-3 cells that received DTBR display greater foci/nucleus than No NP cells with STBR (p = 0.0397 and p < 0.0001, respectively), but GNP-labeled FaDu cells with DTBR demonstrated a decrease in foci/nucleus compared to No NP cells with STBR (p < 0.0001). Lastly, GNP-labeled Detroit-562 and FaDu cells with DTBR displayed significantly less foci/nucleus than with STBR (p < 0.0001 for both), but HSC-3 cells exhibited more (p < 0.0001). (c) Representative confocal images of Detroit-562 cells post RT (Zeiss LSM 710 Laser Scanning Confocal microscope at 40 ×). Scale bars = 20 μm. Results are presented as means of [a] Relative fluorescence intensity and [b] Relative Foci count ± standard error of the mean, p* < 0.05, p** < 0.01, p*** < 0.001, p**** < 0.0001. Significance between groups was tested using a standard t-test with Tukey multiple comparison test (n = 3; 4 images/sample). GNP gold nanoparticles, NoNP no nanoparticles, HNCC head and neck cancer cells, STB(R) standard target beam (radiation), DTB(R) diamond target beam (radiation).

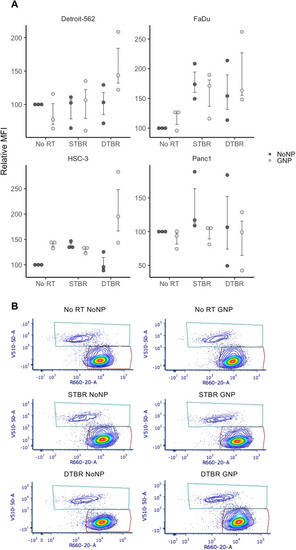
Reactive oxygen species (ROS) were elevated in HNCCs with GNP-facilitated DTBR. Cells were cultured in 6-well plates, irradiated with 8 Gy from the STB or DTB, then processed for flow cytometry 12 h post radiation. (a) Detroit-562, FaDu, and HSC-3 HNCC lines showed a trend towards higher levels of ROS in GNP-labeled cells irradiated with the DTB (these increases were not significant). GNP Panc1 cells demonstrated a reduced level of ROS after DTBR. (b) Representative flow plots of Detroit-562 cells labelled with CellROX Deep Red Reagent (Ex/Em: 644/665) and SYTOX Blue dead cell stain (Ex/Em: 444/480). Results are presented as means of Relative Median fluorescence intensity (MFI) (where relative MFI = net MFI of treated sample/net MFI of untreated sample × 100) ± standard error of the mean, p* < 0.05, p** < 0.01, p*** < 0.001. Significance between groups was tested using a Mann Whitney test (n = 3; ~ 1 × 106 cells per replicate). GNP gold nanoparticles, NoNP no nanoparticles, HNCC head and neck cancer cells, STB(R) standard target beam (radiation), DTB(R) diamond target beam (radiation).

Acknowledgments
This image is the copyrighted work of the attributed author or publisher, and ZFIN has permission only to display this image to its users. Additional permissions should be obtained from the applicable author or publisher of the image. Full text @ Sci. Rep.