
Image
|
Figure Caption
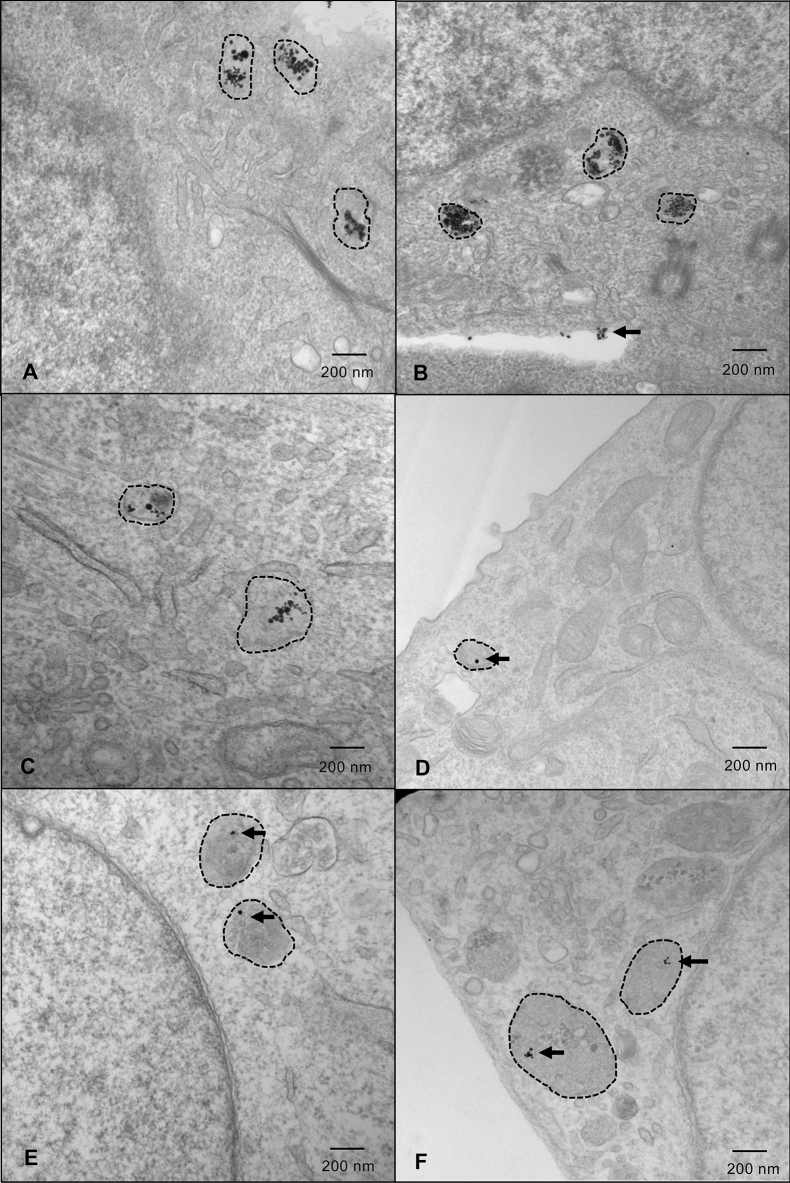
Figure 1
HNC cells demonstrate the greatest uptake of GNPs in lysosomes. Representative images of cells labelled with 25 µM GNPs. Lysosomes are indicated with hashed outlines. (a) FaDu; (b) HSC-3; (c) Detroit-562; (d) SK-N-AS; (e) Panc1; and (f) A673 cells. Cells were fixed approximately 36 h after GNP-labelling (approximate radiation timepoint) and images were captured by a transmission electron microscope. Imaging was done in triplicate—5 images were captured for each sample, with 3 samples/replicate, and 3 replicates in total. HNC head and neck cancer, GNPs gold nanoparticles.
Acknowledgments
This image is the copyrighted work of the attributed author or publisher, and
ZFIN has permission only to display this image to its users.
Additional permissions should be obtained from the applicable author or publisher of the image.
Full text @ Sci. Rep.