
- Title
-
Behavioral and Gene Regulatory Responses to Developmental Drug Exposures in Zebrafish
- Authors
- Mech, A.M., Merteroglu, M., Sealy, I.M., Teh, M.T., White, R.J., Havelange, W., Brennan, C.H., Busch-Nentwich, E.M.
- Source
- Full text @ Front Psychiatry
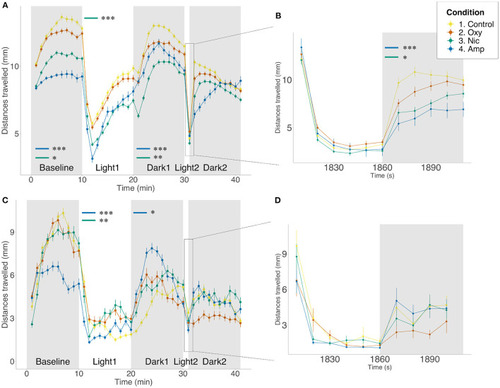
Differences in locomotion in FLD assay. Mean distance traveled per minute by larvae from each treatment group during alternating dark (gray) and light (white) periods. Startle response following 1 min light exposure is displayed in a 10-s resolution plot (B,D). (A,B) Light/dark-induced locomotor responses in 5 dpf larvae in the presence of drug. Sample size n = 96 for each group. (C,D) Light/dark-induced locomotor responses in 6 dpf larvae in the absence of drug. Sample size n = 48 for each group. Significant differences are indicated where present: for locomotion during dark periods (minute 0–10 and 20–30); for slope of recovery in light periods (minute 10–20) and for startle response following 1 min light exposure (B,D). Data shows mean ± SEM. Data was fitted to the linear mixed effect model and post-hoc Tukey test was used to identify multiple correlations (*p < 0.05, **p < 0.01, ***p < 0.001 Tukey's multiple comparison test). |
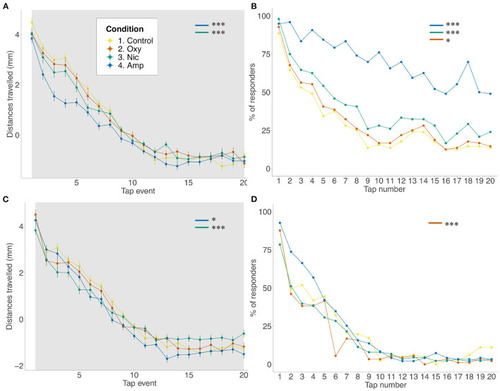
Differences in habituation to acoustic startle. (A,B) Acoustic startle assay at 5 dpf in the presence of the drug. (C,D) Acoustic startle at 6 dpf in the absence of the drug. Tapping sound is delivered every 2 s. (A,C) Habituation to acoustic stimuli by larvae from each group during acoustic stimuli events. Data shows mean ± SEM. Data was fitted to the linear mixed effect model and post-hoc Tukey test was used to identify multiple correlations. (B,D) Proportion of responders for each stimulus event. Beta regression and likelihood ratio tests were performed to assess the interaction between the tap event number and condition. Post-hoc Tukey test was used to identify multiple correlations. Sample size n = 48 for each group (*p < 0.05, ***p < 0.001 Tukey's multiple comparison test). |
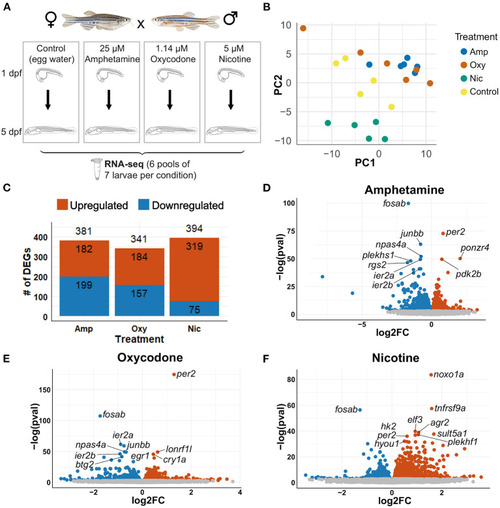
Differential gene expression analysis. (A) Schematic of the experimental design. Zebrafish were exposed to nicotine, oxycodone and amphetamine or left untreated from 1 to 5 dpf before being collected in six pools of seven larvae per condition for RNA-seq. (B) PCA of samples that passed all quality control checks. Samples from each condition group together. Amphetamine and oxycodone samples are clustered more closely (and so have more similar expression profiles) than nicotine samples. (C) Bar chart showing the number of differentially expressed genes (DEGs) in each drug treatment. Upregulated genes are shown in red and downregulated genes are in blue. (D–F) Volcano plots showing the distribution of DEGs. Genes that are not significant (adjusted p-value ≥ 0.05) are in gray, significant genes (adjusted p-value < 0.05) are in red if upregulated and in blue if downregulated. The top 10 DEGs by p-value are labeled in each plot. |
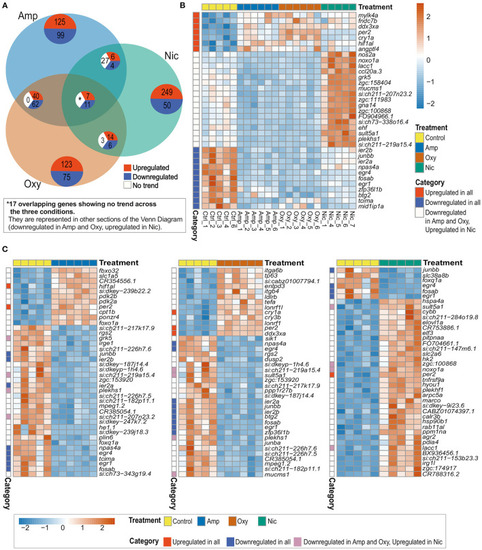
Comparison of DEGs across treatments reveals both common and distinct changes in gene expression. (A) Venn diagram showing the number of overlapping DEGs across treatments. Upregulated genes are in red, downregulated genes in blue and genes showing no overlapping trend in comparisons are shown in white. The asterisk (*) represents 17 of the overlapping DEGs with no overlapping trend across the three conditions. These genes are represented in other sections of the Venn Diagram. (B) Heatmap showing the expression of 35 overlapping DEGs across all treatments. Overlapping DEGs are shown in three categories: upregulated in all treatments, downregulated in all treatments and downregulated in amphetamine and oxycodone but upregulated in nicotine treatment. (C) Heatmaps showing the top 40 DEGs in amphetamine-, oxycodone- and nicotine-treated larvae. Overlapping DEGs are shown in three categories as in (B). Each row/gene of each heatmap has been centered and scaled (mean = 0, standard deviation = 1). |
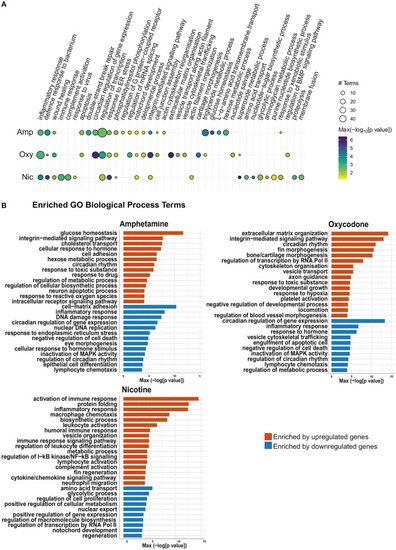
Gene Ontology (GO) term enrichment analysis shows enrichment of both common and distinct biological process terms across treatments. (A) Bubble plot of the GO BP enrichment results across the three drug treatments. Individual enriched BP terms were aggregated to a parent term. For example, regulation of circadian rhythm (GO:0042752), circadian rhythm (GO:0007623) and circadian behavior (GO:0048512) are all aggregated to the parent term circadian regulation of gene expression. The size of each circle represents the number of individual terms enriched for each parent term and they are colored by the smallest of the p-values (–log10 scale). (B) Bar charts showing top 40 upregulated terms and top 40 downregulated terms (by p-value) for each drug treatment. Individual enriched BP terms were aggregated to a representative term and colored by the smallest of the p-values (–log10 scale) as in (A). |
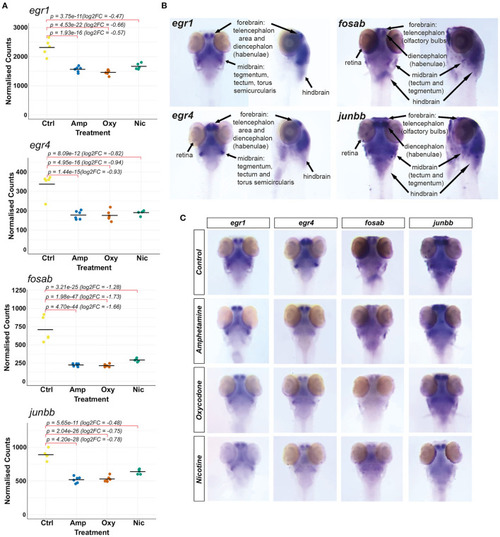
Investigating changes in spatial expression patterns of IEGs which are downregulated in response to developmental exposures. (A) Plots of normalized counts for the candidate genes chosen for mRNA in situ hybridization: fosab, junbb, egr1, and egr4. (B) Annotation of stained neuroanatomical regions in untreated 5 dpf larvae for egr1, egr4, fosab, and junbb. The zebrafish larval brain anatomical atlas (79), schematics of the developing zebrafish brain (http://zebrafishucl.org/zebrafishbrain) and whole-mount mRNA ISH staining images of other genes expressed in distinct neuroanatomical regions at 5 dpf were used as reference for the annotation. (C) Dorsal images of whole-mount mRNA ISH staining of candidate genes in drug-exposed larvae and untreated controls. From left to right: egr1, egr4, fosab, junbb. Lateral images can be found in Supplementary Figure 3. |
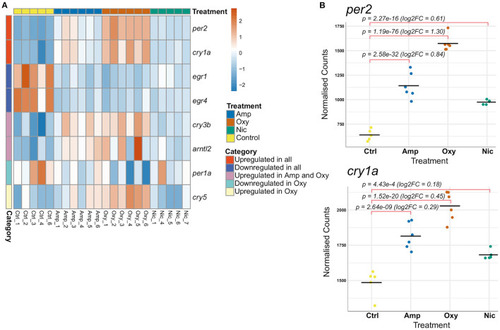
Developmental drug exposures lead to differential expression of circadian regulators. (A) Heatmap showing expression levels of significantly differentially expressed genes involved in the regulation of circadian rhythm across treatments. Each row/gene of the heatmap has been centered and scaled (mean = 0, standard deviation = 1). (B) Plots of normalized counts for the genes per2 and cry1a, which are significantly upregulated in all treatments. |
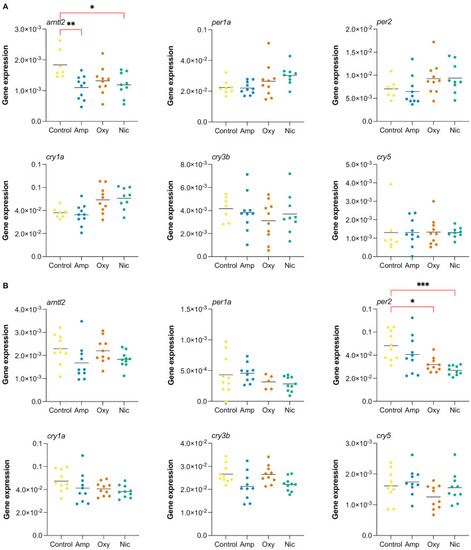
Long-lasting changes in expression of genes involved in circadian cycle. Gene expression analysis of six genes associated with the circadian cycle: arntl2, per1a, per2, cry1a, cry3b, cry5. RT-qPCR was performed at (A) 7 dpf and (B) at 21 dpf (*p < 0.05, **p < 0.01, ***p < 0.001, after Bonferroni multiple test correction). |