
|
Figure 6
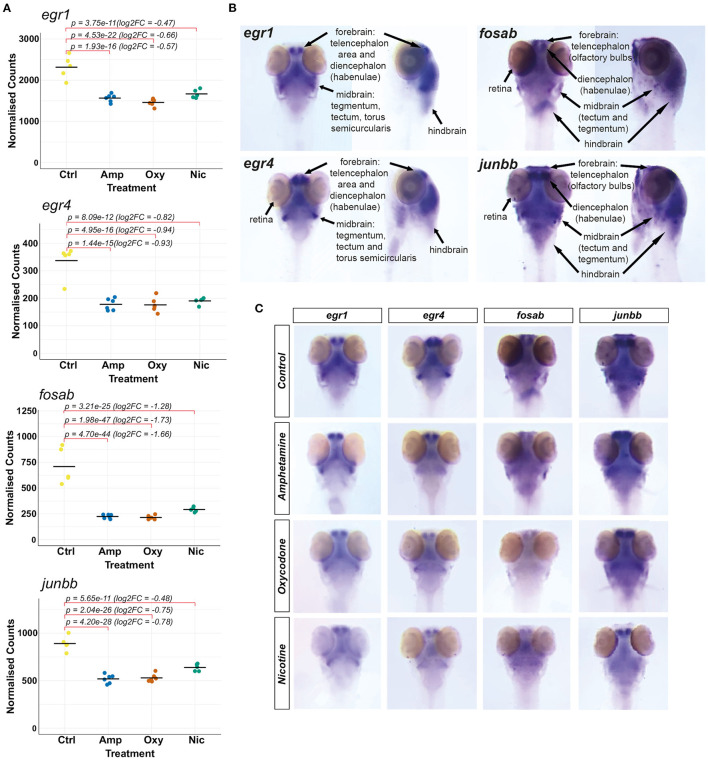
Investigating changes in spatial expression patterns of IEGs which are downregulated in response to developmental exposures. (A) Plots of normalized counts for the candidate genes chosen for mRNA in situ hybridization: fosab, junbb, egr1, and egr4. (B) Annotation of stained neuroanatomical regions in untreated 5 dpf larvae for egr1, egr4, fosab, and junbb. The zebrafish larval brain anatomical atlas (79), schematics of the developing zebrafish brain (http://zebrafishucl.org/zebrafishbrain) and whole-mount mRNA ISH staining images of other genes expressed in distinct neuroanatomical regions at 5 dpf were used as reference for the annotation. (C) Dorsal images of whole-mount mRNA ISH staining of candidate genes in drug-exposed larvae and untreated controls. From left to right: egr1, egr4, fosab, junbb. Lateral images can be found in Supplementary Figure 3.