
|
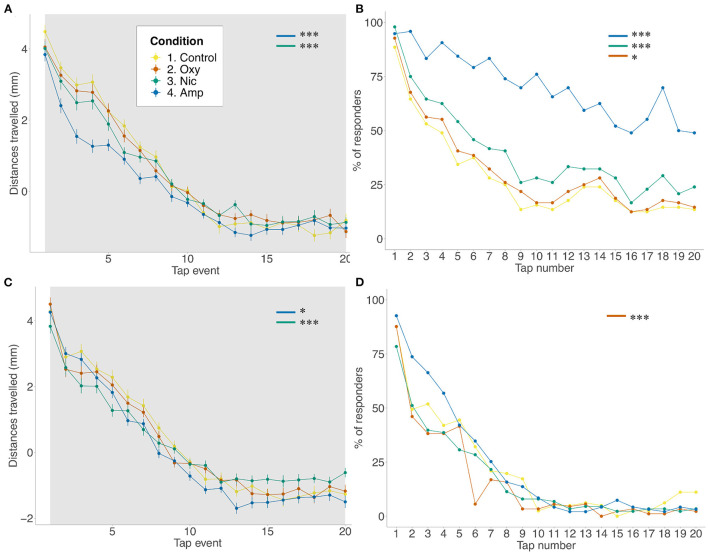
Figure 2
Differences in habituation to acoustic startle. (A,B) Acoustic startle assay at 5 dpf in the presence of the drug. (C,D) Acoustic startle at 6 dpf in the absence of the drug. Tapping sound is delivered every 2 s. (A,C) Habituation to acoustic stimuli by larvae from each group during acoustic stimuli events. Data shows mean ± SEM. Data was fitted to the linear mixed effect model and post-hoc Tukey test was used to identify multiple correlations. (B,D) Proportion of responders for each stimulus event. Beta regression and likelihood ratio tests were performed to assess the interaction between the tap event number and condition. Post-hoc Tukey test was used to identify multiple correlations. Sample size n = 48 for each group (*p < 0.05, ***p < 0.001 Tukey's multiple comparison test).