
|
Figure 4
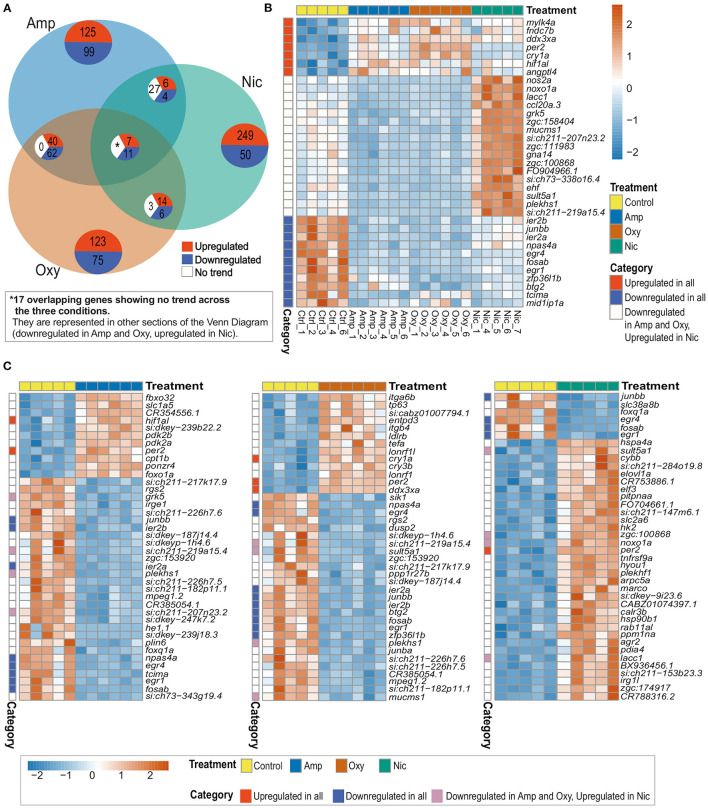
Comparison of DEGs across treatments reveals both common and distinct changes in gene expression. (A) Venn diagram showing the number of overlapping DEGs across treatments. Upregulated genes are in red, downregulated genes in blue and genes showing no overlapping trend in comparisons are shown in white. The asterisk (*) represents 17 of the overlapping DEGs with no overlapping trend across the three conditions. These genes are represented in other sections of the Venn Diagram. (B) Heatmap showing the expression of 35 overlapping DEGs across all treatments. Overlapping DEGs are shown in three categories: upregulated in all treatments, downregulated in all treatments and downregulated in amphetamine and oxycodone but upregulated in nicotine treatment. (C) Heatmaps showing the top 40 DEGs in amphetamine-, oxycodone- and nicotine-treated larvae. Overlapping DEGs are shown in three categories as in (B). Each row/gene of each heatmap has been centered and scaled (mean = 0, standard deviation = 1).