
- Title
-
Effect of Lipopolysaccharides on Liver Tumor Metastasis of twist1a/krasV12 Double Transgenic Zebrafish
- Authors
- Lu, J.W., Lin, L.I., Sun, Y., Liu, D., Gong, Z.
- Source
- Full text @ Biomedicines
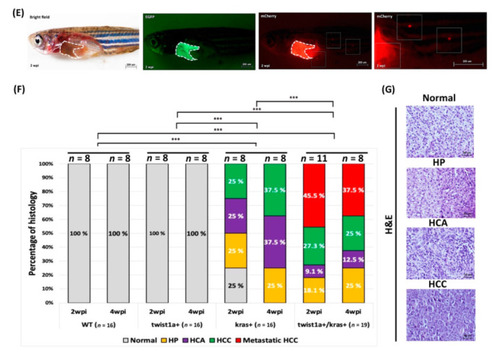
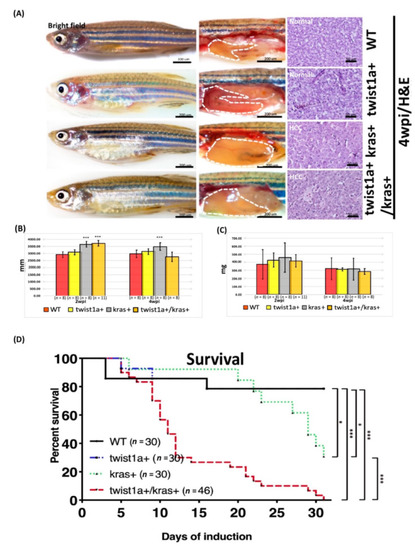
Induction of tumor metastasis in twist1a+/kras+ transgenic zebrafish with Dox treatment. All zebrafish were treated with 20μg/mL Dox and 1μg/mL 4-OHT at 4 mpf, and samples were taken at 2 and 4 wpi. (A) Representative images of wild-type, twist1a+, kras+, and twist1a+/kras+ transgenic zebrafish. The left column shows the external appearance, the middle column shows the internal organs of the abdomen with the liver outlined (white dotted line), and the right column shows H&E staining of liver tissues at 4 wpi. Compared with the wild-type group, (B) the body lengths of kras+ and/or twist1a+/kras+ transgenic zebrafish differed significantly at 2 and 4 wpi, whereas (C) the body weights of transgenic zebrafish did not differ at 2 and 4 wpi. (D) Kaplan-Meier survival curves showing the percentage of survival at 4 wpi. (E) Fluorescence analysis presenting evidence of metastatic HCC at 2 wpi in twist1a+/kras+ zebrafish (white dotted line: primary and metastatic liver tumors). (F) Histological analysis revealed that wild-type, twist1a+, kras+, and twist1a+/kras+ transgenic zebrafish developed HCC or metastatic HCC at 4 wpi. (G) Representative images of normal, HP, HCA, and HCC using histological analysis. Scale bars: 50 or 200 μm. Student’s t-test or one-way ANOVA were used to assess differences between variables: * p < 0.05, *** p < 0.001. PHENOTYPE:
|
Induction of tumor metastasis in twist1a+/kras+ transgenic zebrafish with Dox treatment. All zebrafish were treated with 20μg/mL Dox and 1μg/mL 4-OHT at 4 mpf, and samples were taken at 2 and 4 wpi. (A) Representative images of wild-type, twist1a+, kras+, and twist1a+/kras+ transgenic zebrafish. The left column shows the external appearance, the middle column shows the internal organs of the abdomen with the liver outlined (white dotted line), and the right column shows H&E staining of liver tissues at 4 wpi. Compared with the wild-type group, (B) the body lengths of kras+ and/or twist1a+/kras+ transgenic zebrafish differed significantly at 2 and 4 wpi, whereas (C) the body weights of transgenic zebrafish did not differ at 2 and 4 wpi. (D) Kaplan-Meier survival curves showing the percentage of survival at 4 wpi. (E) Fluorescence analysis presenting evidence of metastatic HCC at 2 wpi in twist1a+/kras+ zebrafish (white dotted line: primary and metastatic liver tumors). (F) Histological analysis revealed that wild-type, twist1a+, kras+, and twist1a+/kras+ transgenic zebrafish developed HCC or metastatic HCC at 4 wpi. (G) Representative images of normal, HP, HCA, and HCC using histological analysis. Scale bars: 50 or 200 μm. Student’s t-test or one-way ANOVA were used to assess differences between variables: * p < 0.05, *** p < 0.001. |
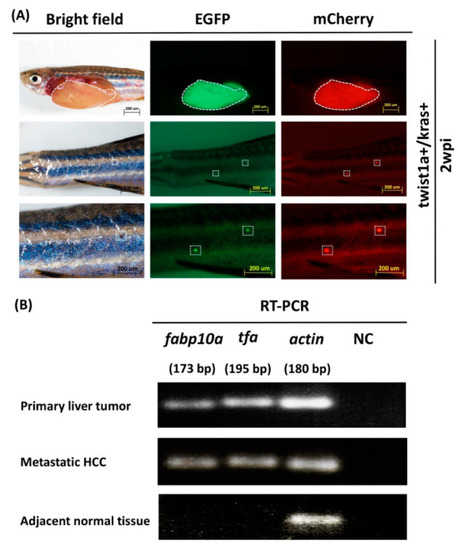
Liver markers in primary and metastatic liver tumor tissues from twist1a+/kras+ double transgenic zebrafish. (A) Immunofluorescence was used to visualize mCherry or EGFP-labeled metastatic liver tumors in twist1a+/kras+ zebrafish (white dotted line: primary and metastatic liver tumors). (B) Semi-quantitative RT-PCR data showing expression levels of fabp10a and tfa in primary liver tumors, metastatic HCC tissues, and adjacent normal muscle tissues. Actin and non-template samples were respectively used as positive and negative controls. Scale bar: 200 μm. EXPRESSION / LABELING:
|
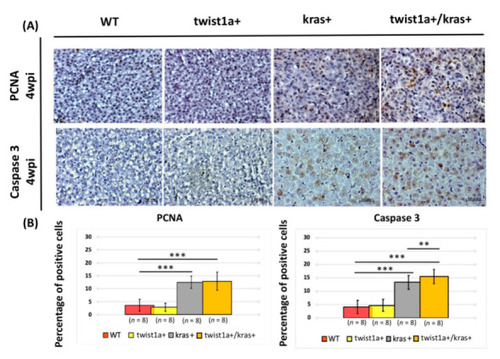
Main hallmarks of cell proliferation and cell apoptosis in liver tissues from twist1a+/kras+ double transgenic zebrafish. (A) Immunohistochemical staining micrograph showing proliferating and apoptotic cells in liver cross-sections from wild-type, twist1a+, kras+, and twist1a+/kras zebrafish. (B) Quantification of the percentage of positive cells for the all fields following PCNA and caspase-3 staining at 4 wpi using ImageJ. Scale bar: 50 μm. Student’s t-tests were used to assess differences between variables: ** p < 0.01, *** p < 0.001. PHENOTYPE:
|
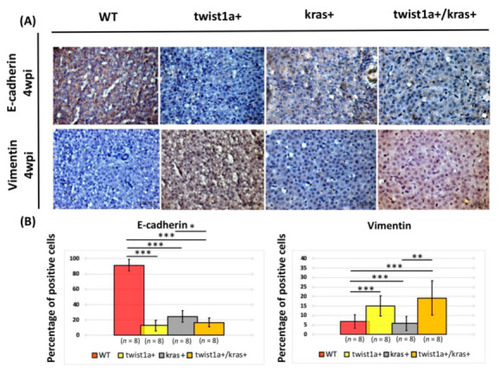
Main EMT hallmarks E-cadherin and Vimentin in liver tissues from twist1a+/kras+ double transgenic zebrafish. (A) Immunohistochemical staining micrograph showing E-cadherin and Vimentin-positive cells in liver cross-sections of wild-type, twist1a+, kras+, and twist1a+/kras+ zebrafish. (B) Quantification of the percentage of E-cadherin and Vimentin-positive cells for all fields following staining at 4 wpi using ImageJ. Scale bar: 50 μm. Student’s t-tests were used to assess differences between variables: * p < 0.05, ** p < 0.01, *** p < 0.001. |
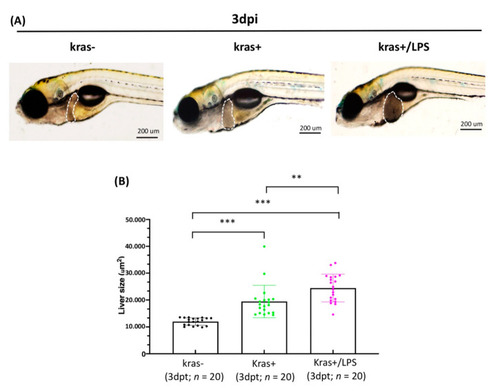
LPS increased liver size in kras+ transgenic zebrafish larvae. (A) Representative images and (B) quantification of liver size in wild-type (kras−) control, kras+, and kras+/LPS zebrafish at 3 dpi (white dotted frame: liver; black dots; green dots; pink dots: the number of zebrafish larvae, respectively). Scale bar: 200 μm. Student’s t-tests were used to assess differences between variables: ** p < 0.01, *** p < 0.001. PHENOTYPE:
|
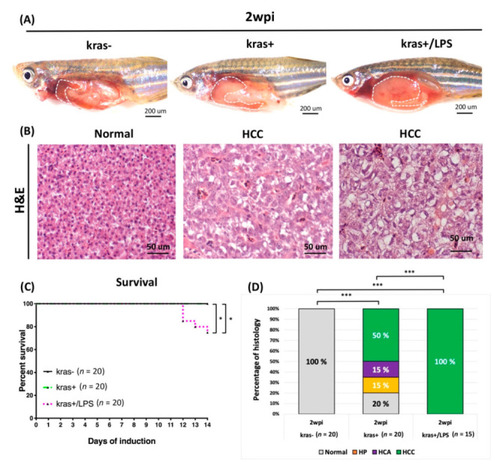
LPS promoted HCC progression in adult kras+ transgenic zebrafish. The wild-type (kras−) control, kras+, and kras+/LPS transgenic zebrafish were treated at 4 mpf with 10μg/mL Dox alone or with 10μg/mL Dox + 40ng/mL LPS, and samples were taken at 2 wpi. (A) The upper row shows the internal organs of the abdomen, and (B) the lower row displays H&E staining of liver sections (white dotted frame: liver). (C) Kaplan-Meier survival curves reveal the percentage of survival at 2 wpi. (D) Histological analysis shows that kras+ and kras+/LPS transgenic zebrafish developed HCC at 2 wpi. Scale bar: 50 or 200 μm. Student’s t-test or one-way ANOVA were used to assess differences between variables: * p < 0.05, *** p < 0.001. PHENOTYPE:
|

LPS enhanced HCC progression in adult twist1a+/kras+ transgenic zebrafish. Twist1a+/kras+ transgenic zebrafish were treated at 3 mpf with Dox and 4-OHT or with Dox, 4-OHT and LPS exposure. Samples were taken at 4 wpi. (A) Immunofluorescence analysis of mCherry and EGFP-labeled metastatic liver tumors and H&E staining of liver tissues from twist1a+/kras+ and twist1a+/kras+/LPS zebrafish at 4 wpi (white dotted frame: primary and metastatic liver tumors). (B,C) No significant differences in body lengths or weights were found between twist1a+/kras+ and twist1a+/kras+/LPS transgenic zebrafish at 2 and 4 wpi. (D) Kaplan-Meier survival curves show the percentage of survival up to 4 wpi. (E) Histological analysis revealed that twist1a+/kras+ and twist1a+/kras+/LPS transgenic zebrafish developed HCC or metastatic HCC at 4 wpi. Scale bar: 50 or 200 μm. Student’s t-test or one-way ANOVA were used to assess differences between variables: ** p < 0.01. PHENOTYPE:
|