
Image
|
Figure Caption
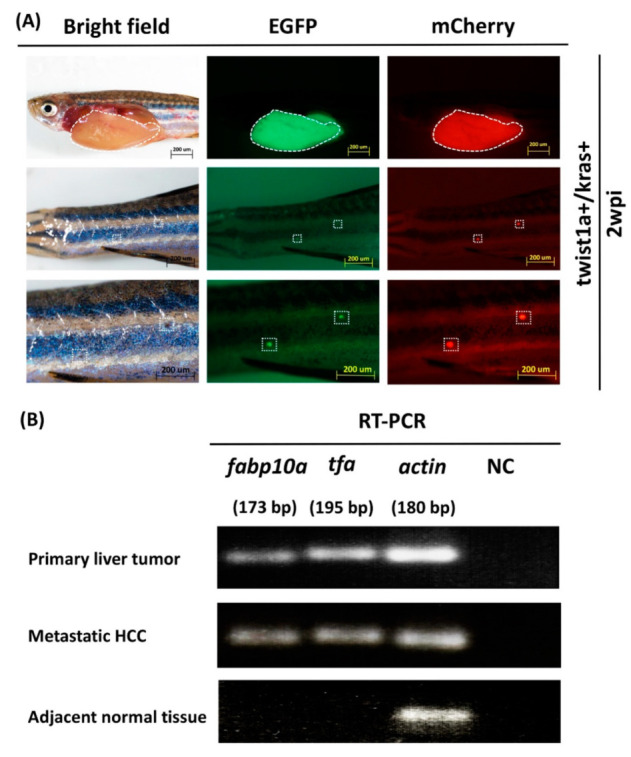
Figure 2
Liver markers in primary and metastatic liver tumor tissues from twist1a+/kras+ double transgenic zebrafish. (A) Immunofluorescence was used to visualize mCherry or EGFP-labeled metastatic liver tumors in twist1a+/kras+ zebrafish (white dotted line: primary and metastatic liver tumors). (B) Semi-quantitative RT-PCR data showing expression levels of fabp10a and tfa in primary liver tumors, metastatic HCC tissues, and adjacent normal muscle tissues. Actin and non-template samples were respectively used as positive and negative controls. Scale bar: 200 μm.
Figure Data
Acknowledgments
This image is the copyrighted work of the attributed author or publisher, and
ZFIN has permission only to display this image to its users.
Additional permissions should be obtained from the applicable author or publisher of the image.
Full text @ Biomedicines