
- Title
-
Cardiac forces regulate zebrafish heart valve delamination by modulating Nfat signaling
- Authors
- Chow, R.W., Fukui, H., Chan, W.X., Tan, K.S.J., Roth, S., Duchemin, A.L., Messaddeq, N., Nakajima, H., Liu, F., Faggianelli-Conrozier, N., Klymchenko, A.S., Choon Hwai, Y., Mochizuki, N., Vermot, J.
- Source
- Full text @ PLoS Biol.
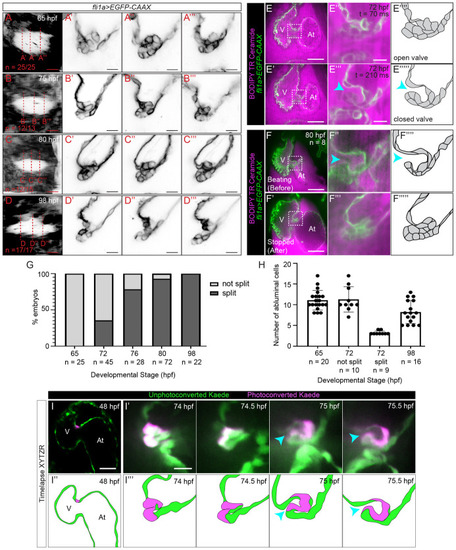
Imaging valves in beating hearts reveals a delamination step during superior AV valve morphogenesis.
(A–C”’) Superior AV valve morphology as revealed using Tg(fli1a:gal4ff;UAS:EGFP-CAAX) at 65, 75, 80, and 98 hpf. (A, B, C, D) shows the AVC as seen when one looks from the ventricle through the AVC lumen into the atrium. The red dotted lines indicate image planes in which (A’–A”’), (B’–B”’), (C’–C”’), and (D’–D”’) are taken. (E–E”’) Selected frames from a movie of a beating heart where a superior AV valve leaflet has formed at 72 hpf. (E) shows the opened state of the valve leaflet during atrial contraction, while (E’) shows the closed state of the valve leaflet during atrial filling. (E”) and (E”’) are drawings showing our interpretations of valve morphology. (F–F””’) Example of an embryo that was imaged twice, first while the heart was beating (F,F”) and again once the heart has been stopped using BDM and tricaine (F’-F”’). (F”) and (F”’) correspond to the boxed regions in (F) and (F’), while (F””) and (F””’) are drawings showing our interpretations of valve morphology. (G) Graph showing percentage of developing superior AV valves that have split to form free-moving valve leaflets. (H) Graph showing number of abluminal cells at various developmental stages as determined using Tg(fli1a:gal4ff;UAS:EGFP-CAAX) embryos that have been immersed in BODIPY TR Ceramide. (I) Image of a Tg(fli1a:Gal4ff;UAS:Kaede) heart at 48 hpf, where a cell located in the AVC has been photoconverted. Scale bar: 50 μm. (I’) Images from a time-lapse movie of the embryo shown in (I) where images of the 3D beating heart were acquired every 30 minutes starting from 74 hpf. The images shown correspond to the point in the cardiac cycle when valve cells are the least compressed. A gap between the 2 cell layers is first observed at 75 hpf and the valve leaflet appears to be free moving by 75.5 hpf. Scale bar 10 μm. (I”,I”’) Interpretation of images shown in (I) and (I’). Cyan arrowheads point to the gap between the valve and the AVC wall. Note that the superior AV valve leaflet is in contact with the developing inferior AV valve in (E’), (E”’), (F), (F”), and the last 2 panels of (I’). The data underlying both graphs can be found in S1 Data. At, atrium; AV, atrioventricular valve; AVC, atrioventricular canal; BDM, 2,3-butanedione monoxime; hpf, hours postfertilization; V, ventricle. |
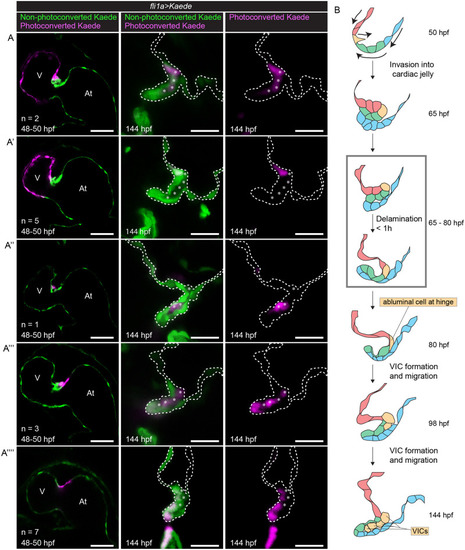
VICs at 144 hpf are derived from abluminal hinge cells at 80 hpf.
(A–A””) Tg(fli1a:gal4ff;UAS:Kaede) embryonic hearts stopped using BDM and photoconverted at 48 to 50 hpf (left column). Embryos were then returned to normal media and allowed to grow normally until 144 hpf, when the hearts were stopped using BDM again and imaged (middle and right columns). (A) Embryos where the ventricle and the cell at the ventricular side of the AVC is photoconverted. Photoconverted cells can be seen between the 2 luminal layers of the valve at 144 hpf. (Ventricular cells appear to have degraded photoconverted Kaede.) (A’) Embryos where the ventricle is photoconverted. Photoconverted cells can be seen at the luminal side of the valve base at 144 hpf. (Ventricular cells appear to have degraded photoconverted Kaede.) (A”) Embryo where one cell migrating in is photoconverted. Photoconverted cells can be seen between the 2 luminal layers of the valve at 144 hpf. (A”’) Embryos where the deepest cell inside the CJ and the atrial edge of the AVC are photoconverted. At 144 hpf, photoconverted cells can be seen between the 2 luminal layers of the valve, presumably derived from the cell that was deepest inside the CJ at 48 to 50 hpf. Luminal photoconverted cells can also be seen at the tip of the valve, presumably derived from the atrial side of the AVC at 48 to 50 hpf. (A””) Embryos where the atrial side of the AVC is photoconverted. Photoconverted cells can be found at the ventricular luminal layer of the valve leaflet. Asterisks label abluminal cells. Scale bar left column: 50 μm. Scale bar middle and right columns: 20 μm. (B) Model for zebrafish valve leaflet formation, cells are colored to indicate their position and fate over time. At 50 hpf, red cells represent ventricular endocardial cells. Yellow cells represent endocardial cells at the ventricular edge of the AVC. Green cells represent the remaining endocardial cells in the AVC. Blue cells represent atrial endocardial cells in the AVC. In subsequent stages, color schemes are kept to show the position and fate of cells over time. Cells derived from cells at 50 hpf due to cell proliferation are colored the same color as their mothers. Arrows in the top drawing indicate cell movements. Gray box marks period at which delamination can occur (65 to 80 hpf). Delamination itself takes place within 1 hour. At, atrium; AVC, atrioventricular canal; BDM, 2,3-butanedione monoxime; CJ, cardiac jelly; hpf, hours postfertilization; V, ventricle; VIC, valve interstitial cell. |
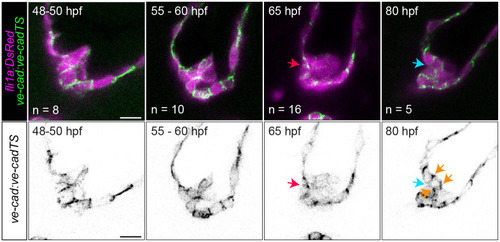
VE-cadherin is reexpressed during delamination stages.
Images of Tg(ve-cad:ve-cad-TS) embryos at 48 to 50, 60, 65, and 80 hpf. Red arrow points to strong VE-cadherin signal between luminal cells at the future delamination site. Cyan arrow points to low VE-cadherin signal between the inner layer of the leaflet and the endocardial cells comprising the AVC wall. Orange arrows point to interfaces where VE-cadherin is up-regulated after being down-regulated following cell migration. Scale bar: 10 μm. AVC, atrioventricular canal; hpf, hours postfertilization. |
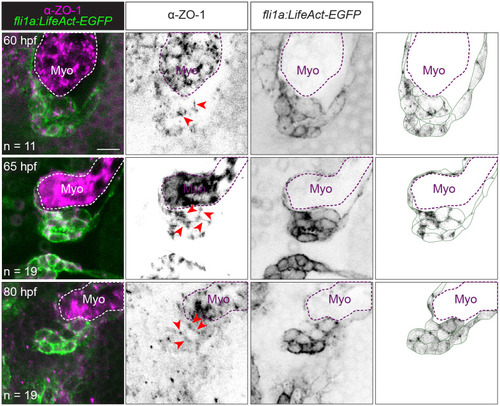
Tight junctions remain present during migration and delamination stages.
Representative images of Tg(fli1a:LifeAct-EGFP) embryos immunostained with ZO-1 at 60, 65, and 80 hpf. The rightmost column shows the ZO-1 signal overlaid on top of an image showing our interpretation of valve cell morphology based on the EGFP signal. Dotted lines outline the Myo. Scale bar: 10 μm. hpf, hours postfertilization; Myo, myocardium; ZO-1, zonula occludens-1. |
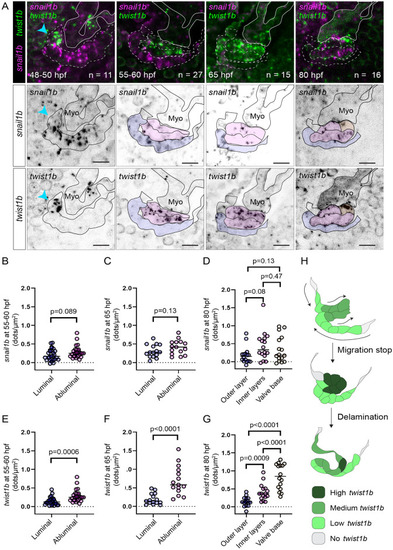
Twist1b, but not snail1b, is expressed highly specifically in abluminal cells.
(A) Representative images of developing superior AV valves between 48 and 80 hpf that have been stained using snail1b and twist1b probes. The top row shows images where channels for snail1b (magenta) and twist1b (green) expression are shown simultaneously. The second and third rows show snail1b and twist1b signal, respectively, with our interpretation of valve morphology superimposed on the images. (B–D) and (E–G) are dot plots showing the number of detected dots, each corresponding to 1 snail1b (B–D) or 1 twist1b (E–G) mRNA molecule, calculated for different valve regions at 55 to 60, 65, and 80 hpf. The color of the dots corresponds to the regions shown in (A) and indicates where the measurement was performed. p-Values were determined using unpaired t test in (B, C, E, F) and using 1-way ANOVA in (D,G). (H) Suggested model showing the dynamics of twist1b expression. Scale bars: 10 μm. AV, atrioventricular valve; hpf, hours postfertilization. |
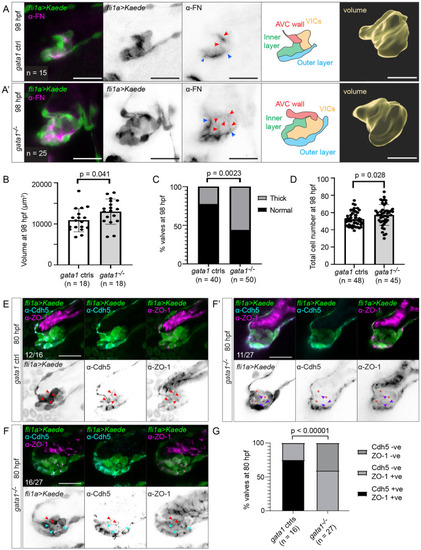
Gata1 mutants have delamination defects and abnormally thick valves.
(A) Gata1 controls and gata1 mutants in the Tg(fli1a:gal4ff;UAS:Kaede) background were analyzed at 98 hpf. Some of these were stained for FN (first to third column). Both control and mutant valves show FN immunoreactivity basal to the luminal layer of valve endocardial cells (between blue arrows), as well as around abluminal cells (red arrows). Schematics in the fourth column show how we demarcate different valve regions at 98 hpf. Fifth column shows 3D rendering of valve surface (inner layer, outer layer, and VICs). Scale bars: 20 μm. (B) Graph showing volume of valves at 98 hpf. p-Value: Welch t test. (C) Graph showing percentage of valves at 98 hpf that appear thick based on fixed embryos. p-Value: Fisher exact test. (D) Total number of cells in the valve region at 98 hpf (AVC wall, inner layer, outer layer, and VICs). p-Value: Welch t test. (E) Gata1 controls immunostained for VE-cadherin and ZO-1 at 80 hpf. In 12/16 embryos, valve cells were immunopositive for both VE-cadherin and ZO-1 (red arrows). (F–F’) Gata1 mutants immunostained for VE-cadherin and ZO-1 at 80 hpf. (F) In 16/27 embryos, some abluminal cells appear to have reexpressed VE-cadherin normally (red arrows), while others are immunopositive for ZO-1 but fail to reexpress VE-cadherin (cyan arrows). (F’) In 11/27 embryos, there is only residual ZO-1 signal in abluminal cells (purple arrows). In regions where ZO-1 signal is absent, gaps are formed between cells (red asterisks). (G) Graph showing quantification of Cdh5 and ZO-1 staining. p-Values are calculated using Fisher exact test for normal expression Cdd5 and ZO-1 expression pattern (Cdh5 +ve, ZO-1 +ve) versus abnormal expression Cdd5 and ZO-1 pattern (Cdh5 –ve, ZO-1 –ve; Cdh5 –ve, ZO-1 –ve). Scale bars: 20 μm. AVC, atrioventricular canal; FN, fibronectin; hpf, hours postfertilization; VIC, valve interstitial cell; ZO-1, zonula occludens-1. |
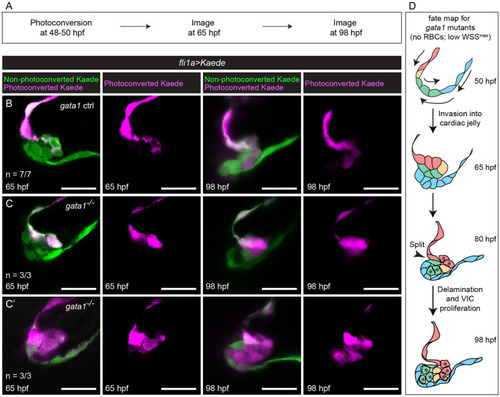
Photoconversion experiments show that delamination defects in gata1 mutants result in misassignment of cells from luminal to abluminal cell fate.
(A) Flow diagram summarizing the method used in this set of photoconversion experiments. At 48 to 50 hpf, embryonic hearts were stopped using BDM and the ventricle and the ventricular side of the AVC were photoconverted. The embryos were then returned to normal media and allowed to grow normally until 65 hpf, when the heart was stopped again using BDM and the valve imaged (first and second columns in (B–C’)). They were then returned to normal media and allowed to grow normally until 98 hpf, when the heart was stopped using BDM and they were imaged again (third and fourth columns in (B–C’)). (B) Representative images of gata1 controls showing that if the superior layer of the abluminal bilayer and the cell deepest in the CJ is photoconverted at 65 hpf, then all abluminal cells will be photoconverted at 98 hpf. (C) Representative images of gata1 mutants showing that if the superior layer of the abluminal bilayer and the cell deepest in the CJ is photoconverted at 65 hpf, then only some abluminal cells near the base of the valve will be photoconverted at 98 hpf. (C’) Representative images of gata1 mutants, showing that if the entire abluminal bilayer is photoconverted at 65 hpf, then all abluminal cells are photoconverted at 98 hpf. (D) Proposed fate map of gata1 mutants. Cells are colored to indicate position and fate over time. Asterisks at 80 hpf denote cells that have been misassigned from luminal to abluminal cell fate and their progeny. AVC, atrioventricular canal; BDM, 2,3-butanedione monoxime; CJ, cardiac jelly; hpf, hours postfertilization; RBC, red blood cell; VIC, valve interstitial cell; WSS, wall shear stress. |
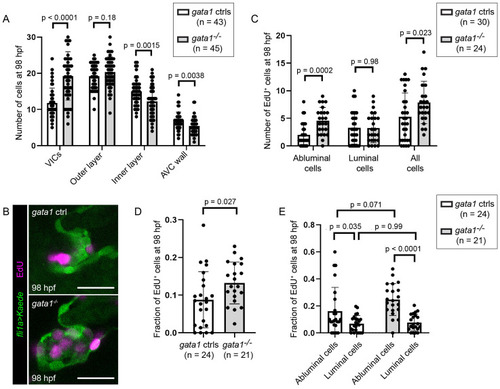
Delamination defects in gata1 mutants leads to increased cell proliferation.
(A) Number of cells in different valve regions at 98 hpf. p-Values based on unpaired t test. (B) Representative images of 98 hpf gata1 control and mutant valves incubated with EdU from 74 to 98 hpf. Scale bars: 20 μm. (C) Graph showing number of EdU positive cells in 98 hpf gata1 controls and mutant valves. p-Values are based on unpaired t tests. (D) Graph showing fraction valve cells that stained positive for EdU in 98 hpf gata1 controls and mutant valves. p-Values are based on Welch t test. (E) Graph showing fraction of abluminal and luminal cells in 98 hpf gata1 controls and mutant valves that stained positive for EdU. p-Values are based on 2-way ANOVA. AVC, atrioventricular canal; hpf, hours postfertilization; VIC, valve interstitial cell. |
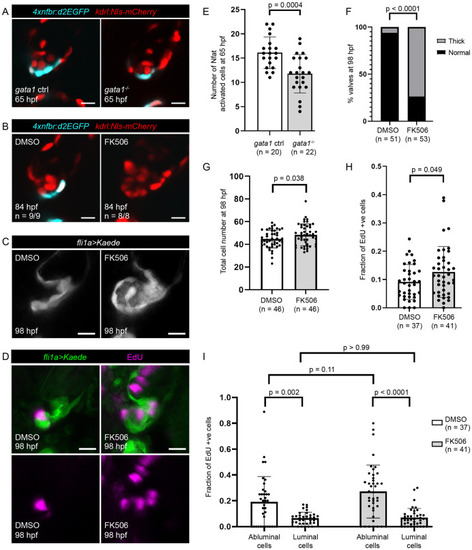
Inhibition of flow-dependent Nfatc signaling results in abnormally thick valves.
(A) Tg(4xnfbr:d2EGFP) is a reporter line for Nfat activity. Representative images of gata1 mutants and controls in the Tg(4xnfbr:d2EGFP);Tg(kdrl:nls-mCherry) background at 65hpf. (B) Representative images of valves in 84 hpf Tg(4xnfbr:d2EGFP);Tg(kdrl:nls-mCherry) embryos that have been treated with DMSO or FK506 from 60 hpf. (C) Representative images of 98 hpf valves in Tg(fli1a:gal4;UAS:Kaede) embryos treated with DMSO or FK506 from 60 to 98 hpf. (D) Representative images of embryos treated with DMSO or FK506 from 60 to 98 hpf and EdU from 74 to 98 hpf. (E) Graph showing number of Nfat activated cells in 65 hpf superior AV valves as determined using the Tg(4xnfbr:d2EGFP);Tg(kdrl:nls-mCherry) line. p-Values were calculated using unpaired t test. (F) Graph showing percentage of embryos with thick superior AV valves in embryos treated with DMSO and FK506 from 60 to 98 hpf. Statistical significance was calculated using Fisher exact test. (G) Graph showing number of cells in the superior AVC in embryos treated with DMSO and FK506 from 60 to 98 hpf. Statistical significance was calculated using Student t test. (H) Graph showing the fraction of EdU positive cells in the superior AVC in embryos treated with DMSO or FK506 from 60 to 98 hpf and EdU from 74 hpf to 98 hpf. Statistical significance determined by Student t test. (I) Graph showing the fraction of EdU positive luminal cells and EdU positive abluminal cells in embryos treated with DMSO or FK506 from 60 to 98 hpf and EdU from 74 hpf to 98 hpf. Statistical significance was determined by 2-way ANOVA. AV, atrioventricular valve; AVC, atrioventricular canal; hpf, hours postfertilization; Nfat, nuclear factor of activated T cells. |
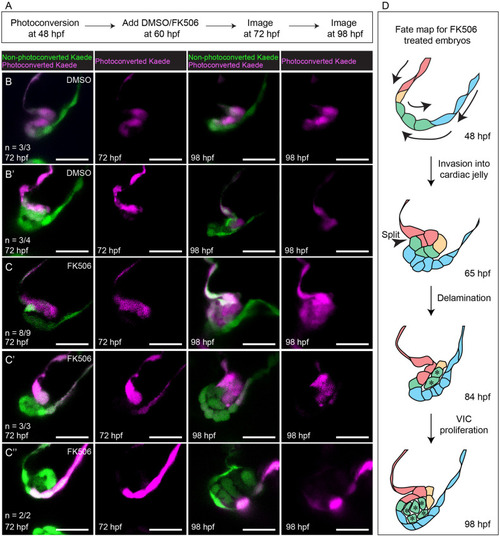
Photoconversion experiments show that delamination defects in FK506-treated embryos results in misassignment of cells from luminal to abluminal cell fate.
(A) Flow diagram summarizing the method used in these photoconversion experiments. (B–B’) Representative images showing that DMSO treatment does not cause misassignment of cell fate. (C–C”) Representative images showing that FK506 treatment results in misassignment of cells from luminal to abluminal cell fate. Scale bars: 20 μm (D) Proposed fate map of FK506-treated embryos. Cells are colored to indicate position and fate over time. Asterisks denote cells that have been misassigned from luminal to abluminal cell fate and their progeny. hpf, hours postfertilization; VIC, valve interstitial cell. |
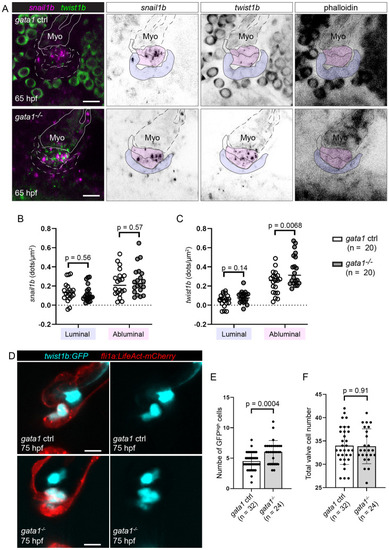
Gata1 mutants have increased twist1b, but not snail1b, expression at 65 hpf.
(A) Representative images of the developing superior AV valves at 65 hpf that have been stained using snail1b and twist1b probes in gata1 controls (top row) and mutants (bottom row). Our interpretation of valve morphology superimposed on the images and blue (luminal) and magenta (abluminal) regions are used for quantifications in (B) and (C). (B, C) Dot plots showing the number of detected dots, each corresponding to1 snail1b (B) or 1 twist1b (C) mRNA molecule, in luminal and abluminal valve regions (shaded in purple and pink, respectively, in (A)). Statistical significance was calculated using Student t test. (D) Example images of gata1 mutants and controls in the Tg(twist:GFP);Tg(fli1a:Lifeact-mCherry) background. (E) Graph showing the number of cells with bright GFP signal (GFPhigh cells) in Tg(twist:GFP);Tg(fli1a:Lifeact-mCherry) gata1 mutants and controls. Statistical significance was determined using Student t test. (F) Total valve cell number in the same embryos used for quantification in (E). Statistical significance was determined using Student t test. Scale bars: 10 μm. AV, atrioventricular valve; hpf, hours postfertilization; Myo, myocardium. |
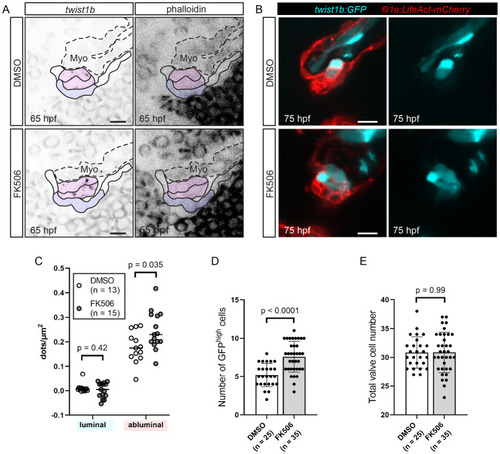
FK506-treated embryos have increased twist1b expression at 65 hpf.
(A, C) Wild-type embryos were treated with DMSO or FK506 from 60 hpf, fixed at 65 hpf, and twist1b RNAscope was performed. (A) Representative images of developing superior AV valves at 65 hpf that have been stained using the twist1b probe in DMSO-treated controls (top row) and FK506-treated embryos (bottom row). Our interpretation of valve morphology superimposed on the images and blue (luminal) and magenta (abluminal) regions are used for quantifications in (C). (B, D, E) Tg(twist:GFP);Tg(fli1a:Lifeact-mCherry) embryos were treated with DMSO or FK506 from 60 hpf to 75 hpf. (B) Example images of DMSO-treated and FK506-treated embryos in the Tg(twist:GFP);Tg(fli1a:Lifeact-mCherry) background. (C) Dot plots showing the number of detected dots, each corresponding to 1 twist1b mRNA molecule in luminal and abluminal valve regions (shaded in purple and pink, respectively, in (A)). Statistical significance was calculated using Student t test. (D) Graph showing the number of cells with bright GFP signal (GFPhigh cells) in Tg(twist:GFP);Tg(fli1a:Lifeact-mCherry) embryos treated with DMSO or FK506. Statistical significance was determined using Student t test. (E) Total valve cell number in the same embryos used for quantification in (D). Statistical significance was determined using Student t test. Scale bars: 10 μm. AV, atrioventricular valve; hpf, hours postfertilization; Myo, myocardium. |
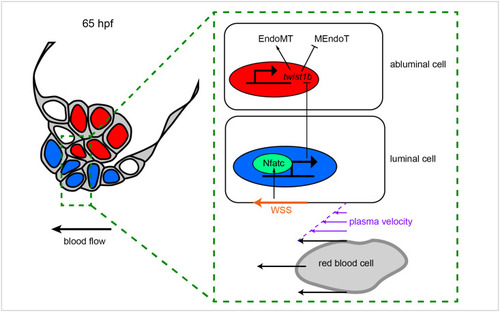
Proposed mechanotransduction pathway regulating valve delamination.
At 65 hpf, just prior to delamination, WSS (orange arrow) activates Nfatc signaling in luminal cells. This leads to the production of a secreted signal that results in the inhibition of twist1b expression in abluminal cells. Since twist1b causes abluminal cells to transition toward more mesenchymal cell states, its inhibition is necessary to allow MEndoT, a process key to correct valve delamination. EndoMT, endothelial–mesenchymal transition; hpf, hours postfertilization; MEndoT, mesenchymal–endothelial transition; WSS, wall shear stress. |