Image
Figure Caption
Fig 3
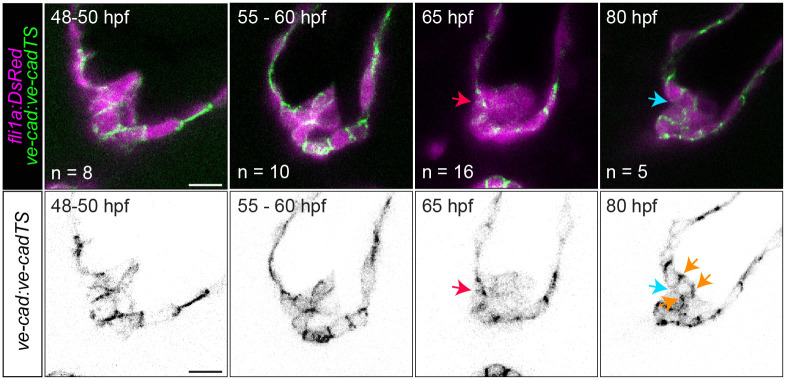
VE-cadherin is reexpressed during delamination stages.
Images of Tg(ve-cad:ve-cad-TS) embryos at 48 to 50, 60, 65, and 80 hpf. Red arrow points to strong VE-cadherin signal between luminal cells at the future delamination site. Cyan arrow points to low VE-cadherin signal between the inner layer of the leaflet and the endocardial cells comprising the AVC wall. Orange arrows point to interfaces where VE-cadherin is up-regulated after being down-regulated following cell migration. Scale bar: 10 μm. AVC, atrioventricular canal; hpf, hours postfertilization.
Acknowledgments
This image is the copyrighted work of the attributed author or publisher, and
ZFIN has permission only to display this image to its users.
Additional permissions should be obtained from the applicable author or publisher of the image.
Full text @ PLoS Biol.

