
Image
|
Figure Caption
Fig 4
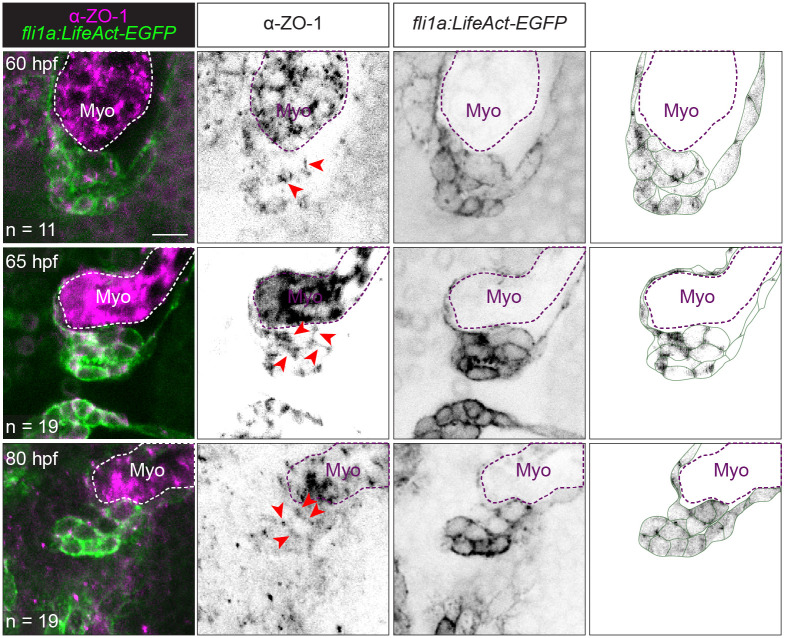
Tight junctions remain present during migration and delamination stages.
Representative images of Tg(fli1a:LifeAct-EGFP) embryos immunostained with ZO-1 at 60, 65, and 80 hpf. The rightmost column shows the ZO-1 signal overlaid on top of an image showing our interpretation of valve cell morphology based on the EGFP signal. Dotted lines outline the Myo. Scale bar: 10 μm. hpf, hours postfertilization; Myo, myocardium; ZO-1, zonula occludens-1.
Acknowledgments
This image is the copyrighted work of the attributed author or publisher, and
ZFIN has permission only to display this image to its users.
Additional permissions should be obtained from the applicable author or publisher of the image.
Full text @ PLoS Biol.