
|
Fig 1
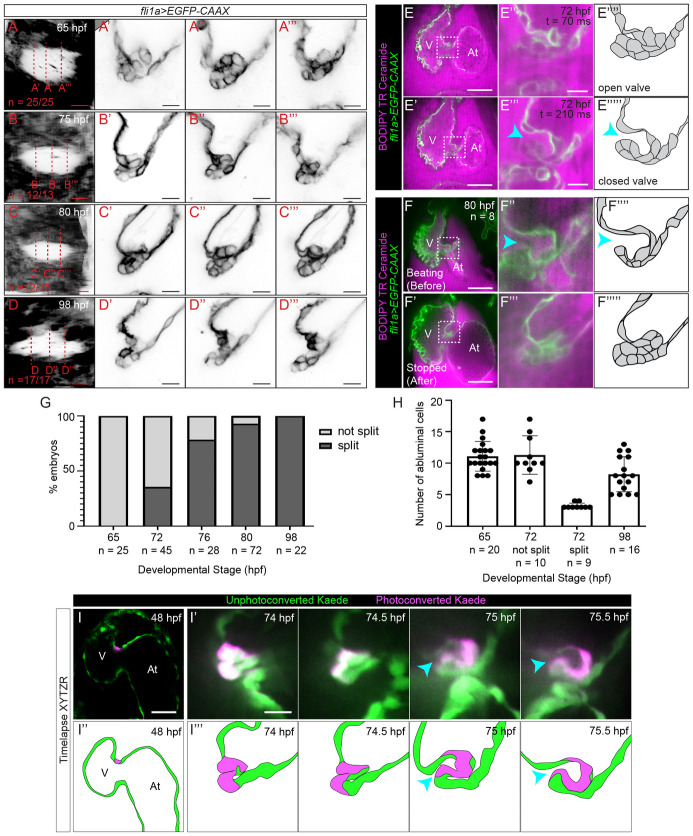
(A–C”’) Superior AV valve morphology as revealed using Tg(fli1a:gal4ff;UAS:EGFP-CAAX) at 65, 75, 80, and 98 hpf. (A, B, C, D) shows the AVC as seen when one looks from the ventricle through the AVC lumen into the atrium. The red dotted lines indicate image planes in which (A’–A”’), (B’–B”’), (C’–C”’), and (D’–D”’) are taken. (E–E”’) Selected frames from a movie of a beating heart where a superior AV valve leaflet has formed at 72 hpf. (E) shows the opened state of the valve leaflet during atrial contraction, while (E’) shows the closed state of the valve leaflet during atrial filling. (E”) and (E”’) are drawings showing our interpretations of valve morphology. (F–F””’) Example of an embryo that was imaged twice, first while the heart was beating (F,F”) and again once the heart has been stopped using BDM and tricaine (F’-F”’). (F”) and (F”’) correspond to the boxed regions in (F) and (F’), while (F””) and (F””’) are drawings showing our interpretations of valve morphology. (G) Graph showing percentage of developing superior AV valves that have split to form free-moving valve leaflets. (H) Graph showing number of abluminal cells at various developmental stages as determined using Tg(fli1a:gal4ff;UAS:EGFP-CAAX) embryos that have been immersed in BODIPY TR Ceramide. (I) Image of a Tg(fli1a:Gal4ff;UAS:Kaede) heart at 48 hpf, where a cell located in the AVC has been photoconverted. Scale bar: 50 μm. (I’) Images from a time-lapse movie of the embryo shown in (I) where images of the 3D beating heart were acquired every 30 minutes starting from 74 hpf. The images shown correspond to the point in the cardiac cycle when valve cells are the least compressed. A gap between the 2 cell layers is first observed at 75 hpf and the valve leaflet appears to be free moving by 75.5 hpf. Scale bar 10 μm. (I”,I”’) Interpretation of images shown in (I) and (I’). Cyan arrowheads point to the gap between the valve and the AVC wall. Note that the superior AV valve leaflet is in contact with the developing inferior AV valve in (E’), (E”’), (F), (F”), and the last 2 panels of (I’). The data underlying both graphs can be found in S1 Data. At, atrium; AV, atrioventricular valve; AVC, atrioventricular canal; BDM, 2,3-butanedione monoxime; hpf, hours postfertilization; V, ventricle.