
- Title
-
Predictive and therapeutic implications of a novel PLCγ1/SHP2-driven mechanism of cetuximab resistance in metastatic colorectal cancer
- Authors
- Cruz-Duarte, R., de Almeida, C.R., Negrão, M., Fernandes, A., Borralho, P., Sobral, D., Gallego-Paez, L.M., Machado, D., Gramaça, J., Vílchez, J., Xavier, A.T., Godinho Ferreira, M., Miranda, A.R., Mansinho, H., Brito, M.J., Pacheco, T.R., Abreu, C., Lucia-Costa, A., Mansinho, A., Fior, R., Costa, L., Martins, M.
- Source
- Full text @ Clin. Cancer Res.
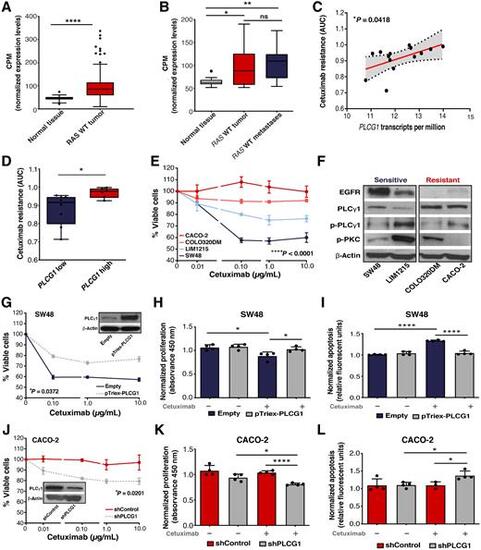
PLCγ1 expression in colorectal cancer and its association with cetuximab responses. A, Comparison of PLCG1 mRNA expression levels in RAS WT tumors (n = 273) versus normal colonic mucosa (n = 41) from TCGA-COAD dataset. B,PLCG1 mRNA expression of paired RAS WT tumors, normal samples, and liver metastasis from AMC cohort (n = 13). C, Correlation between the levels of PLCG1 expression [RNA-seq TPM gene expression quantification from the Broad Institute Cancer Cell Line Encyclopedia (CCLE)] and cetuximab resistance (drug sensitivity measurements of GDSC from the Cancer Dependency Map Portal) in colorectal cancer RAS WT cell lines (n = 14). P value corresponds to the Spearman correlation test. Drug sensitivity was measured as AUC which corresponds to the AUC in which values of 0 correspond to complete reduction in cell viability and values of 1 correspond to no reduction in cell viability. Fitted linear regression line and its 95% CIs are indicated by the red line and shaded area, respectively. D, Cetuximab resistance of RAS WT colorectal cancer cell lines grouped by low or high PLCG1 expression based on the analysis of GDSC and CCLE data (n = 14; unpaired t test). E, Cell viability of colorectal cancer cell lines measured 72 hours after initial exposure to cetuximab (n = 4, two-way ANOVA test). F, Western blotting of EGFR and PLCγ1 downstream signaling. β-Actin was used as the loading control. G–I, Cell viability (n = 4, two-way ANOVA test), proliferation, and apoptosis rate of parental and PLCG1 overexpressing SW48 cells (pTriex-PLCG1) upon 72 hours of treatment with cetuximab (unpaired t test). J–L, Cell viability (n = 4, two-way ANOVA test), proliferation, and apoptosis rate of shControl and shPLCG1 CACO-2 cell line after 72 hours of treatment with cetuximab (unpaired t test). Results are presented as the mean ± SEM. (*, P ≤ 0.05; **, P ≤ 0.01; ****, P ≤ 0.0001). |
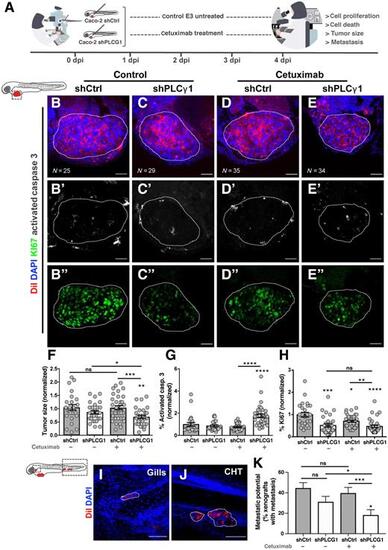
Zebrafish xenotransplant model of shControl and shPLCG1 CACO-2 cells treated with cetuximab. A, Human cancer cell line CACO-2 (shCtrl and shPLCG1) was fluorescently labeled with DiI (red) and injected into the perivitelline space (PVS) of 2 days postfertilization (dpf) nacre/casper zebrafish larvae. Zebrafish xenografts were treated in vivo with cetuximab for 72 hours and compared with untreated controls regarding tumor size, cell death, cell proliferation, and metastasis formation. B–E”, At 4 dpi, zebrafish xenografts were imaged on PVS and over the zebrafish body by confocal microscopy. F, Analysis of tumor size (*, P = 0.0387; **, P = 0.0063; ***, P = 0.0007). G, Analysis of activated caspase 3 (apoptosis; ****, P < 0.0001). H, Percentage of Ki-positive cells (*, P = 0.0191; **, P = 0.0021; ***, P = 0.0001; ****, P< 0.0001). I and J, Representative images of CACO-2 micrometastasis. K, Metastasis quantification (shPLCG1 versus shPLCG1 cetuximab *P = 0.0238, shCTRL versus shPLCG1 cetuximab *P = 0.0124, shCTRL cetuximab versus shPLCG1 cetuximab ***P = 0.0004). The outcomes are expressed as AVG ± SEM. Results are from two independent experiments and the number of xenografts analyzed are indicated in the representative images. Each dot represents one zebrafish xenograft. Statistical analysis was performed as described in Statistical Analysis section (ns > 0.05; *, P ≤ 0.05; **P ≤ 0.01; ***P ≤ 0.001, ****P ≤ 0.0001). Scale bars represent 50 μm. All images are anterior to the left, posterior to right, dorsal up, and ventral down. PHENOTYPE:
|
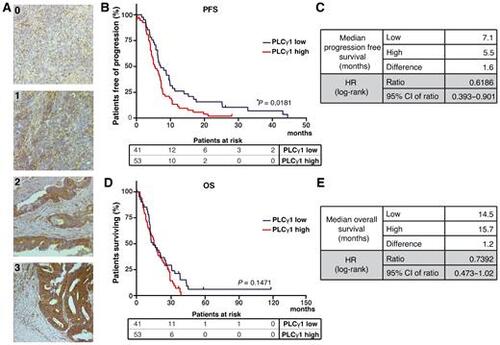
PLCγ1 expression in colorectal cancer tumors and its association with cetuximab responses. A, IHC analysis of PLCγ1 expression in human colorectal cancer specimens. Intensity of PLCγ1 cytoplasmic staining in tumor cells ranges from 0 (absence of staining) to 3 (maximal intensity; magnification, 200×). B–E, Kaplan–Meier curves of PFS and OS of patients with colorectal cancer expressing high and low levels of PLCγ1. Median time of survival for both analyses is shown in the picture. P value of the Kaplan–Meier curves was calculated using the log-rank test. |
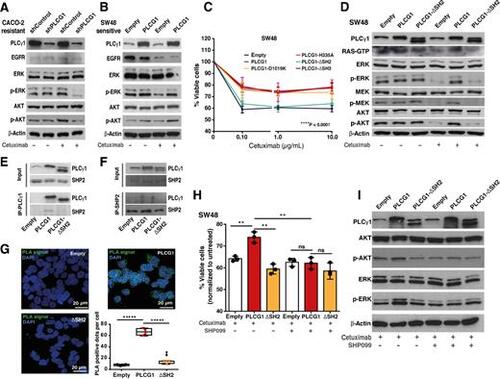
Role of PLCγ1 nSH2-CSH2 domains and its interaction with SHP2 for cetuximab resistance. A and B, Western blotting of CACO-2 (shControl and shPLCG1) and SW48 (parental and pTriex-PLCG1 overexpressed) cells treated with cetuximab for 72 hr. EGFR downstream signaling, namely ERK and AKT are shown. β-actin was used as the loading control. C, Cell viability of parental SW48 and PLCG1-overexpressing cells: full length WT; constitutively active mutant - D1019K; constitutively inactive mutant - H335A; deletion of both nSH2-CSH2 tandem domains - ΔSH2; and deletions of SH3 domain - ΔSH3 (n = 3). Analysis was performed using two-way ANOVA test (****P < 0.0001). D, Western blotting of EGFR downstream signaling of SW48 parental and overexpressing PLCG1 WT and PLCG1 ΔSH2 mutant, after 72 hr of cetuximab treatment. β-Actin was used as the loading control. E, Co-immunoprecipitation of PLCγ1 with anti-Stag antibody and Western blot analysis of PLCγ1 and SHP2 of 72 hours cetuximab treated SW48 cells. F, Co-immunoprecipitation of SHP2 with anti-SHP2 antibody and Western blot analysis of PLCγ1 and SHP2 of 72 hours cetuximab treated SW48 cells. G, Proximity ligation assay of PLCγ1 and SHP2 using anti-Stag and anti-SHP2 antibodies in SW48 parental, PLCG1 WT- and ΔSH2-overexpressing cells and corresponding quantification (n = 4). H, Cell viability of SW48 parental and overexpressing PLCG1 WT and ΔSH2 mutant, treated with cetuximab and cetuximab + SHP099 for 72 hours (n = 3). I, Western blotting of EGFR downstream signaling of SW48 parental and overexpressing PLCG1 WT and ΔSH2 mutant, treated with cetuximab and cetuximab + SHP099. Results are presented as the mean ± SEM. Statistical analysis was performed using unpaired t test [not significant (ns), P > 0.05; **, P < 0.01]. |
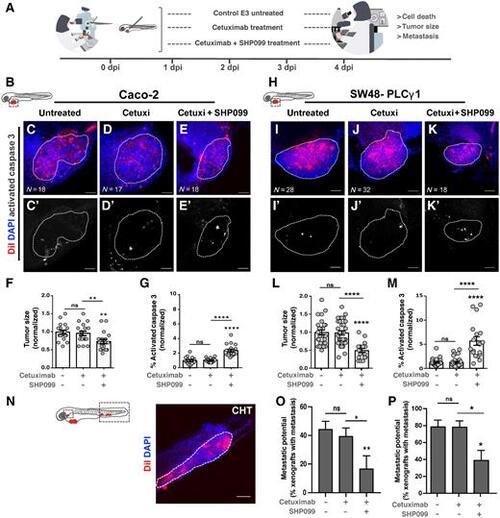
Zebrafish xenotransplant model of CACO-2 shControl and SW48-PLCγ1 cells treated with cetuximab and SHP099. A, Cetuximab-resistant CACO-2 shControl and SW48-PLCγ1 were fluorescently lableled with DiI (red) and injected into the PVS of 2 dpf nacre/casper zebrafish larvae. Zebrafish xenografts were treated in vivo with cetuximab and SHP099 and compared with untreated controls regarding tumor size, cell death, and metastasis. B–E', At 4 dpi, zebrafish CACO-2 xenografts were imaged on PVS and over the zebrafish body by confocal microscopy. F, Analysis of CACO-2 tumor size (shControl vs. shControl cetuximab + SHP099, **P = 0.0017; shControl cetuximab vs. shControl cetuximab + SHP099, **P = 0.0096). G, Analysis of CACO-2 tumors activated caspase 3 (apoptosis; shControl vs. shControl cetuximab + SHP099, ****P < 0.0001; shControl cetuximab vs. shControl cetuximab + SHP099, ****P < 0.0001). H–K', At 4 dpi, zebrafish SW48–PLCγ1 xenografts were imaged on PVS and over the zebrafish body by confocal microscopy. L, Analysis of SW48–PLCγ1 tumor size (SW48–PLCγ1 vs. SW48–PLCγ1 cetuximab + SHP099, ****P < 0.0001; SW48–PLCγ1 cetuximab vs. SW48–PLCγ1 cetuximab + SHP099, ****P < 0.0001). M, Analysis of SW48–PLCγ1 tumors activated caspase 3 (apoptosis; SW48–PLCγ1 vs. SW48–PLCγ1 cetuximab + SHP099, ****P < 0.0001; SW48–PLCγ1 cetuximab vs. SW48–PLCγ1 cetuximab + SHP099, ****P < 0.0001). N, Representative image of micrometastasis in CHT. O, Analysis of CACO-2 metastasis (shControl cetuximab versus shControl cetuximab + SHP099, *P = 0.0219; shControl versus shPLCγ1 cetuximab + SHP099, **P = 0,0046). P, Analysis of SW48–PLCγ1 metastasis (SW48–PLCγ1 cetuximab vs. SW48–PLCγ1 cetuximab + SHP099, *P = 0.0127; SW48–PLCγ1 vs. SW48–PLCγ1 cetuximab + SHP099, *P = 0.0116). The outcomes are expressed as AVG ± SEM (ns > 0.05; *, P ≤ 0.05; **, P ≤ 0.01; ***, P ≤ 0.001; ****, P ≤ 0.0001). Scale bars = 50 μm. |