
Image
|
Figure Caption
Fig. 3
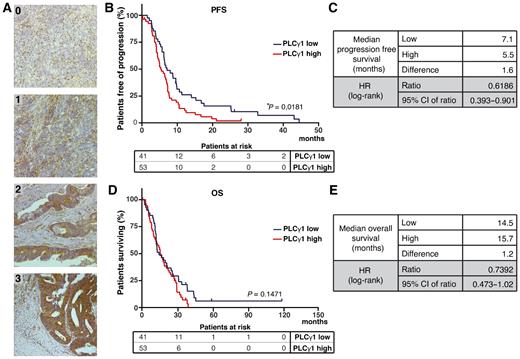
PLCγ1 expression in colorectal cancer tumors and its association with cetuximab responses. A, IHC analysis of PLCγ1 expression in human colorectal cancer specimens. Intensity of PLCγ1 cytoplasmic staining in tumor cells ranges from 0 (absence of staining) to 3 (maximal intensity; magnification, 200×). B–E, Kaplan–Meier curves of PFS and OS of patients with colorectal cancer expressing high and low levels of PLCγ1. Median time of survival for both analyses is shown in the picture. P value of the Kaplan–Meier curves was calculated using the log-rank test.
Acknowledgments
This image is the copyrighted work of the attributed author or publisher, and
ZFIN has permission only to display this image to its users.
Additional permissions should be obtained from the applicable author or publisher of the image.
Full text @ Clin. Cancer Res.