
|
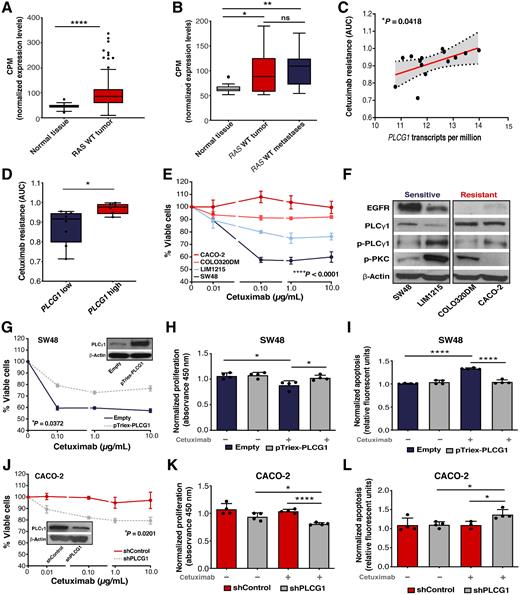
Fig. 1
PLCγ1 expression in colorectal cancer and its association with cetuximab responses. A, Comparison of PLCG1 mRNA expression levels in RAS WT tumors (n = 273) versus normal colonic mucosa (n = 41) from TCGA-COAD dataset. B,PLCG1 mRNA expression of paired RAS WT tumors, normal samples, and liver metastasis from AMC cohort (n = 13). C, Correlation between the levels of PLCG1 expression [RNA-seq TPM gene expression quantification from the Broad Institute Cancer Cell Line Encyclopedia (CCLE)] and cetuximab resistance (drug sensitivity measurements of GDSC from the Cancer Dependency Map Portal) in colorectal cancer RAS WT cell lines (n = 14). P value corresponds to the Spearman correlation test. Drug sensitivity was measured as AUC which corresponds to the AUC in which values of 0 correspond to complete reduction in cell viability and values of 1 correspond to no reduction in cell viability. Fitted linear regression line and its 95% CIs are indicated by the red line and shaded area, respectively. D, Cetuximab resistance of RAS WT colorectal cancer cell lines grouped by low or high PLCG1 expression based on the analysis of GDSC and CCLE data (n = 14; unpaired t test). E, Cell viability of colorectal cancer cell lines measured 72 hours after initial exposure to cetuximab (n = 4, two-way ANOVA test). F, Western blotting of EGFR and PLCγ1 downstream signaling. β-Actin was used as the loading control. G–I, Cell viability (n = 4, two-way ANOVA test), proliferation, and apoptosis rate of parental and PLCG1 overexpressing SW48 cells (pTriex-PLCG1) upon 72 hours of treatment with cetuximab (unpaired t test). J–L, Cell viability (n = 4, two-way ANOVA test), proliferation, and apoptosis rate of shControl and shPLCG1 CACO-2 cell line after 72 hours of treatment with cetuximab (unpaired t test). Results are presented as the mean ± SEM. (*, P ≤ 0.05; **, P ≤ 0.01; ****, P ≤ 0.0001).