
Fig. 5
- ID
- ZDB-FIG-220822-33
- Publication
- Cruz-Duarte et al., 2022 - Predictive and therapeutic implications of a novel PLCγ1/SHP2-driven mechanism of cetuximab resistance in metastatic colorectal cancer
- Other Figures
- All Figure Page
- Back to All Figure Page
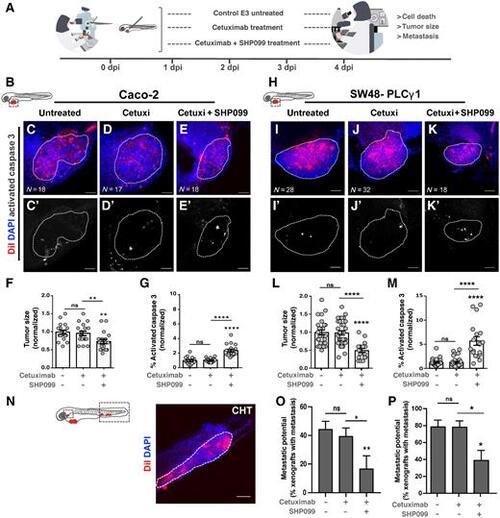
Zebrafish xenotransplant model of CACO-2 shControl and SW48-PLCγ1 cells treated with cetuximab and SHP099. A, Cetuximab-resistant CACO-2 shControl and SW48-PLCγ1 were fluorescently lableled with DiI (red) and injected into the PVS of 2 dpf nacre/casper zebrafish larvae. Zebrafish xenografts were treated in vivo with cetuximab and SHP099 and compared with untreated controls regarding tumor size, cell death, and metastasis. B–E', At 4 dpi, zebrafish CACO-2 xenografts were imaged on PVS and over the zebrafish body by confocal microscopy. F, Analysis of CACO-2 tumor size (shControl vs. shControl cetuximab + SHP099, **P = 0.0017; shControl cetuximab vs. shControl cetuximab + SHP099, **P = 0.0096). G, Analysis of CACO-2 tumors activated caspase 3 (apoptosis; shControl vs. shControl cetuximab + SHP099, ****P < 0.0001; shControl cetuximab vs. shControl cetuximab + SHP099, ****P < 0.0001). H–K', At 4 dpi, zebrafish SW48–PLCγ1 xenografts were imaged on PVS and over the zebrafish body by confocal microscopy. L, Analysis of SW48–PLCγ1 tumor size (SW48–PLCγ1 vs. SW48–PLCγ1 cetuximab + SHP099, ****P < 0.0001; SW48–PLCγ1 cetuximab vs. SW48–PLCγ1 cetuximab + SHP099, ****P < 0.0001). M, Analysis of SW48–PLCγ1 tumors activated caspase 3 (apoptosis; SW48–PLCγ1 vs. SW48–PLCγ1 cetuximab + SHP099, ****P < 0.0001; SW48–PLCγ1 cetuximab vs. SW48–PLCγ1 cetuximab + SHP099, ****P < 0.0001). N, Representative image of micrometastasis in CHT. O, Analysis of CACO-2 metastasis (shControl cetuximab versus shControl cetuximab + SHP099, *P = 0.0219; shControl versus shPLCγ1 cetuximab + SHP099, **P = 0,0046). P, Analysis of SW48–PLCγ1 metastasis (SW48–PLCγ1 cetuximab vs. SW48–PLCγ1 cetuximab + SHP099, *P = 0.0127; SW48–PLCγ1 vs. SW48–PLCγ1 cetuximab + SHP099, *P = 0.0116). The outcomes are expressed as AVG ± SEM (ns > 0.05; *, P ≤ 0.05; **, P ≤ 0.01; ***, P ≤ 0.001; ****, P ≤ 0.0001). Scale bars = 50 μm. |