
- Title
-
Wasp controls oriented migration of endothelial cells to achieve functional vascular patterning
- Authors
- Rosa, A., Giese, W., Meier, K., Alt, S., Klaus-Bergmann, A., Edgar, L.T., Bartels, E., Collins, R., Szymborska, A., Coxam, B., Bernabeu, M.O., Gerhardt, H.
- Source
- Full text @ Development
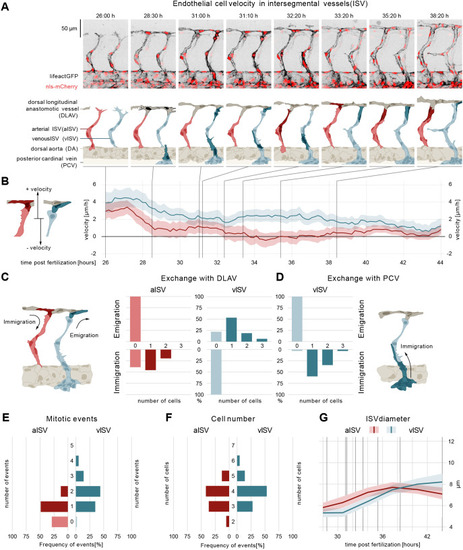
ECs of arterial and venous ISVs show different velocity profiles. (A) Montage of two ISV sprouts from 26-38 hpf. Top panel: live imaging of Tg[fliep:nls-mCherry; fliep:lifeactGFP]. Black, F-actin; red, nuclei. Bottom panel: pictogram of live imaging. Red ECs represent cells in aISV; blue ECs represent cells in vISV. Dark red ECs indicate cell division events (time point 32:20) and immigration of cells from DLAV to aISV (time points 33:20, 35:20-38:20). Dark blue cells indicate secondary sprouts (time point 28:30), vascular remodelling (time point 31:00, most ventral EC), cell division events (time point 31:00, most dorsal ECs), emigration of ECs towards the DLAV (time point 31:10, 33:20-38:20) and immigration of ECs from the PCV (time point 31:00-32:20). Dark grey cells represent cell anastomosis (time point 28:30). (B) EC velocity (µm/h) over time (hpf). Red, velocity for ECs in aISV; blue, velocity of ECs in vISV. Left pictogram demonstrates positive and negative velocity relative to dorsal and ventral movement, respectively. (C) Number of cells that exchange from ISVs with DLAV and fractions of ISVs that are affected. (D) Number of cells that exchange from PCV with vISV and corresponding fractions of vISVs. (E) Number of mitotic events in ISVs. (F) Cell number in ISVs 44 hpf and distribution among ISVs. (G) Vessel diameter (µm) over time (hpf) for aISV (red) and vISV (blue). Black vertical lines represent the equivalent time points in montage. Data are mean and 95% confidence interval. |
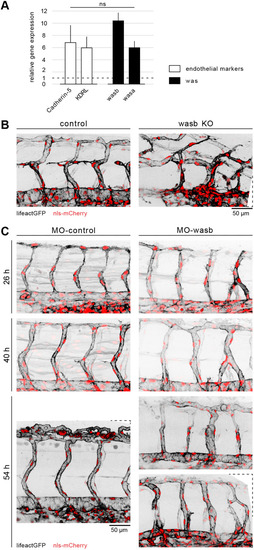
Vascular morphology is dependent on Wasb. (A) RT-PCR of 24 hpf FACS-processed ECs from Tg[fliep:eGFP]. Data are mean+s.e.m. (B) Trunk vasculature of 44 hpf Tg[fliep:nls-mCherry; fliep:lifeactGFP] F0 embryo injected with Cas9 mRNA (control) and Cas9 mRNA plus guide mRNA (wasb KO). (C) MO-control and MO-wasb Tg[fliep:nls-mCherry; fliep:lifeactGFP] embryos. Top panel of MO-wasb shows large vISVs with large diameter and aISVs with reduced diameter. Lower panel shows an example of a vascular malformation. |
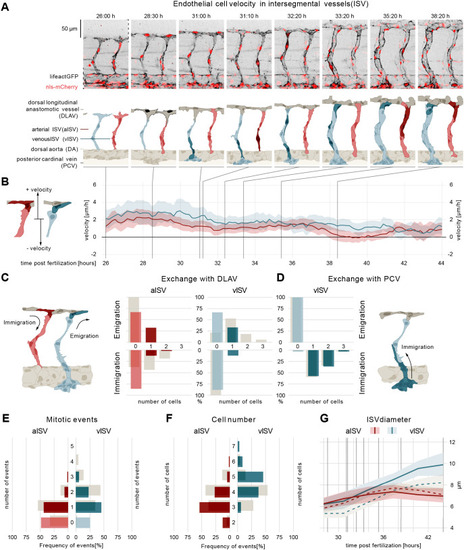
Wasb is required for oriented cell migration. (A) Montage of two ISV sprouts from 26 hpf to 38 hpf in MO-wasb embryo. Top panel: live imaging of Tg[fliep:nls-mCherry; fliep:lifeactGFP] MO-wasb. Black, F-actin; red, nuclei. Bottom panel: pictogram of live imaging. Red ECs represent cells in aISVs; blue ECs represent cells in vISVs. Dark red ECs indicate cell division events (time point 31:10) and emigration of cells from aISV to DLAV (time points 35:20-38:20). Dark blue and dark red cells indicate vascular remodelling (time point 31:00), cell division (time point 32:20, 33:20) and emigration of ECs towards the DLAV (time point 31:10, 33:20-38:20). Dark grey cells represent cell anastomosis (time point 28:30). (B) EC velocity (µm/h) over time (hpf). Red, velocity for ECs in aISVs; blue, velocity of ECs in vISV. Left pictogram demonstrates positive and negative velocity relative to dorsal and ventral movement, respectively. (C) Number of cells that exchange from ISVs with DLAV and fractions of ISVs that are affected (immigration from DLAV to aISV AKS test, P<0.05; emigration from vISV to DLAV AKS test, P<0.05; MO-control versus MO-wasb). (D) Number of cells that exchange from PCV with vISV and corresponding fractions of vISVs. (E) Number of mitotic events in ISVs (MO-control versus MO-wasb vISV, AKS test P<0.05). (F) Cell number in ISVs 44 hpf and distribution among ISVs (MO-control versus MO-wasb vISV, AKS test P<0.05). Grey bars (C-F) are values of MO-control. (G) Vessel diameter (µm) over time (hpf) for MO-control aISV (dotted redline), MO-wasb aISV (full redline), MO-control vISV (dotted blue line) and MO-wasb vISV (full blue line). Black vertical lines represent the equivalent time points in montage. Data are mean and 95% confidence interval. |

WSS prevents vessel diameter and cell number variability. (A) EC velocity (µm/h) over time (hpf) of MO-gata1 embryos. Red, velocity for ECs in aISVs; blue, velocity of ECs in vISV. (B) Number of cells that exchange from ISVs with DLAV and fractions of ISVs that are affected (AKS test P>0.05, MO-control versus MO-gata1). (C) Number of cells that exchange from PCV with vISV and corresponding fractions of vISVs. (D) Number of mitotic events in ISVs (AKS test P>0.05, MO-control versus MO-gata1). (E) Cell number in ISV at 44 hpf and distribution among ISVs (AKS test P>0.05, MO-control versus MO-gata1). (F) Vessel diameter (µm) over time (hpf) for MO-gata1 ISV (red line, aISV; blue line, vISV). (G) EC velocity (µm/h) over time (hpf) of MO-gata1/wasb embryos. Red, velocity for ECs in aISVs; blue, velocity of ECs in vISV. (H) Number of cells that exchange from ISVs with DLAV and fractions of ISVs that are affected (AKS test P>0.05, MO-gata1 versus MO-gata1/wasb). (I) Number of cells that exchange from PCV with vISV and corresponding fractions of vISVs. (J) Number of mitotic events in ISVs (AKS test aISV P<0.05, MO-gata1 versus MO-gata1/wasb; AKS test vISV P>0.05 MO-gata1 versus MO-gata1/wasb). (K) Cell number in ISVs 44 hpf and distribution among ISVs (AKS test aISV P<0.05, MO-gata1 versus MO-gata1/wasb; AKS test vISV P>0.05, MO-gata1 versus MO-gata1/wasb). (L) Vessel diameter (µm) over time (hpf) for MO-gata1/wasb ISV (red line, aISV; blue line, vISV). Grey bars (B-E,H-K) are values of MO-control. Data are mean and 95% confidence interval. |
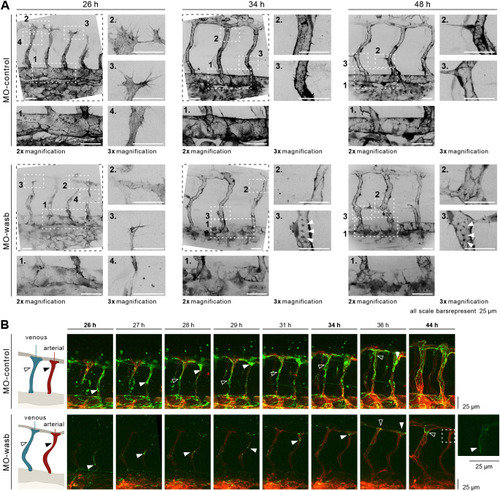
Wasb is required for F-actin regulation and junctional Pecam1 localization. (A) Upper panel: trunk vasculature of Tg[fliep:lifeactGFP] MO-control. F-actin is mostly prominent at 26 hpf in filopodia (inset 3), cell-cell contacts of anastomosis (inset 2), cell cortex and stress fibres (inset 4). In the DA, F-actin accumulates at cell junctions (inset 1). At 34 hpf and later at 48 hpf F-actin is enriched at junctions of ISV (insets 2 and 3) and DA (insets 1). Lower panel: trunk vasculature of Tg[fliep:lifeactGFP] MO-wasb. F-actin is decreased during anastomosis (inset 3) with heterogeneous accumulation at the cortex and loss of stress fibres (inset 4). Filopodia still show F-actin accumulation (inset 2). In the DA junctional F-actin is lost (inset 1). At 34 hpf and later at 48 hpf junctional accumulation is heterogenous (insets 2) and in the form of puncta (insets 3). In the DA F-actin has heterogeneous accumulation (insets 1). (B) MO-control: Pecam1 (green) junctional localization in remodelling vessels labels migratory cells. White arrowhead labels migratory stalk EC in aISV. Dorsal movement from 26 to 29 h. Diffuse Pecam1 localization at 34 hpf. Ventral movement at 36 hpf. Black arrowhead labels migratory stalk EC in vISV with dorsal movement from 28 to 36 hpf. MO-wasb: Pecam1 is lost or reduced in EC junctions. White arrowhead labels migratory stalk EC in aISVs with dorsal movement from 26 to 36 hpf. Inset (right) labels second stalk cell with ventral-to-dorsal orientation. Black arrowhead labels migratory EC entering vISV from 36 to 44 h. Red labels ECs membrane. |

WASp controls migration and PECAM1 localization in HUVECs. (A) Phase contrast images of control and was siRNA-treated HUVECs in a confluent monolayer. (B) Scratch wound assay for control and was siRNA-treated HUVECs at baseline (immediately after removing barrier) and after16 h. (C) Quantification of wound closure at 16 h. Data are mean±s.d. of three independent experiments (six biological replicates). (D) Effective velocity of HUVECs during wound closure assay. Samples have a significant velocity difference, P<0.0001 (Welch's two sample t-test). (E) Rosette graph showing the prevalent cell direction during wound closure in control and was siRNA-treated cells. Comparison between graphs: P<0.001 (Watson's two-sample test of homogeneity). (F) HUVECs treated for control and was siRNA stained for f-actin (Phalloidin, red in combined), PECAM1 (green in combined) and nuclei (DAPI, blue). |

Illustration of the principal morphodynamic behaviours that differentially control regular vessel diameter formation in arteries and veins of the zebrafish trunk. A vISV (blue) is shown with two ECs undergoing division (black arrowhead), and with one cell immigrating from the PCV (the PCV vessel is not fully illustrated) and one cell emigrating to the DLAV (all morphodynamic events are highlighted in dark blue). Note that in the vISV, emigration and immigration are balanced, and cell numbers are increased by proliferation. Two arteries (red) are shown either side of the vISV. On the left, the aISV receives a cell by immigration from the DLAV (dark red). On the right, the aISV increases its cell number by cell division (dark red). In aISVs, these two processes are depicted as alternatives, as they seldom coincide. The directional movement of EC from vISV to the DLAV, and from the DLAV to aISV, requires WASp. |