
|
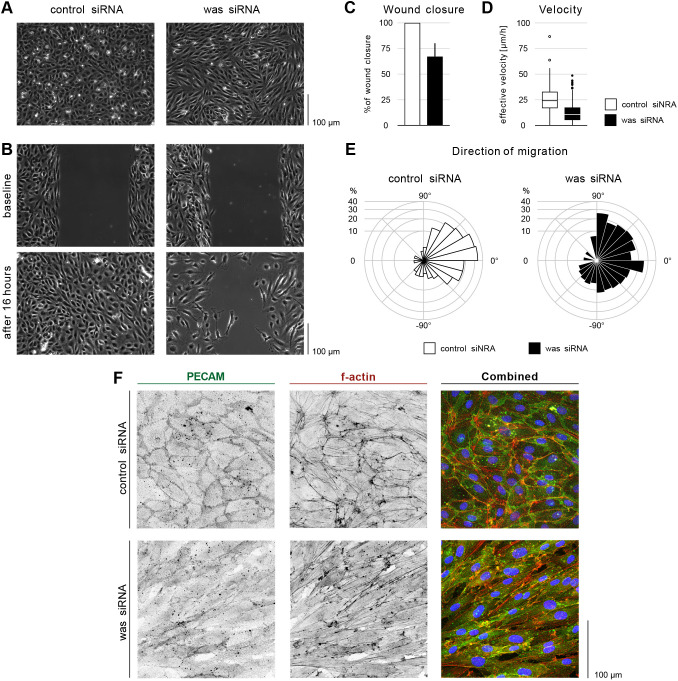
Fig. 6.
WASp controls migration and PECAM1 localization in HUVECs. (A) Phase contrast images of control and was siRNA-treated HUVECs in a confluent monolayer. (B) Scratch wound assay for control and was siRNA-treated HUVECs at baseline (immediately after removing barrier) and after16 h. (C) Quantification of wound closure at 16 h. Data are mean±s.d. of three independent experiments (six biological replicates). (D) Effective velocity of HUVECs during wound closure assay. Samples have a significant velocity difference, P<0.0001 (Welch's two sample t-test). (E) Rosette graph showing the prevalent cell direction during wound closure in control and was siRNA-treated cells. Comparison between graphs: P<0.001 (Watson's two-sample test of homogeneity). (F) HUVECs treated for control and was siRNA stained for f-actin (Phalloidin, red in combined), PECAM1 (green in combined) and nuclei (DAPI, blue).