
- Title
-
STAG2 loss rewires oncogenic and developmental programs to promote metastasis in Ewing sarcoma
- Authors
- Adane, B., Alexe, G., Seong, B.K.A., Lu, D., Hwang, E.E., Hnisz, D., Lareau, C.A., Ross, L., Lin, S., Dela Cruz, F.S., Richardson, M., Weintraub, A.S., Wang, S., Iniguez, A.B., Dharia, N.V., Conway, A.S., Robichaud, A.L., Tanenbaum, B., Krill-Burger, J.M., Vazquez, F., Schenone, M., Berman, J.N., Kung, A.L., Carr, S.A., Aryee, M.J., Young, R.A., Crompton, B.D., Stegmaier, K.
- Source
- Full text @ Cancer Cell
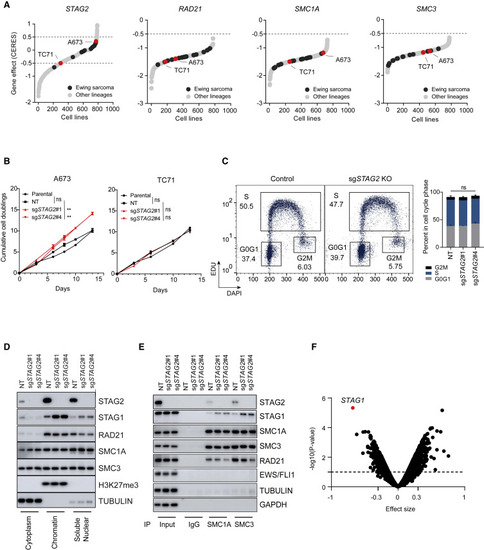
Loss of STAG2 does not consistently alter cell growth but changes the composition of the cohesin complex and renders cells sensitive to STAG1 deletion (A) Hockey plots depicting the distribution of STAG2, SMC1A, SMC3, and RAD21 gene effect (CERES) scores across the 789 cell lines in CRISPR (Avana) Depmap v20Q3 data. (B) Line graphs showing mean ± SD of cumulative doublings for parental or clonally selected non-targeting (NT) or STAG2 KO A673 and TC71 cells. Pairwise comparative analysis for exponential growth fitted curves. Extra-sum-of-squares F test, ∗∗p < 0.01; ns, not significant. (C) EdU (5-ethynyl-2′-deoxyuridine) incorporation-based cell-cycle profiling and representative flow-cytometry plots (left) are shown. Two independent experiments as mean ± SD bar plots (right). Two-way ANOVA; ns, not significant. (D and E) Subcellular fractionation (D) or immunoprecipitation with SMC1A, SMC3, or IgG (E) followed by western blot was performed for the indicated proteins. (F) Genome-scale CRISPR/Cas9 screen in isogenic NT and STAG2 KO A673 clonal cells. Shown is the volcano plot for gene effect size versus −log10(p value) for the genome-wide differential analysis of isogenic NT versus STAG2 KO processed reads; dots represent genes (limma eBayes for MAGeCK gene effect scores, effect size ≤ −0.3, adjusted p ≤ 0.10). |
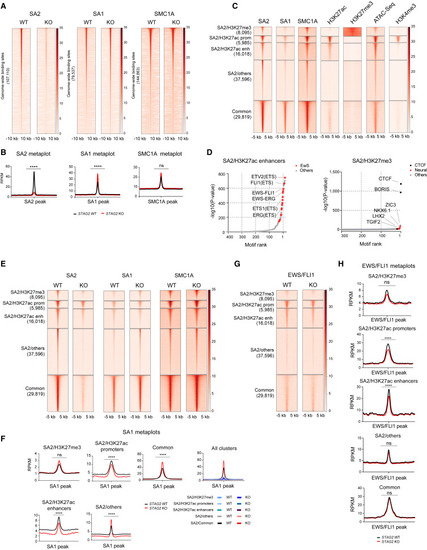
STAG2 occupies PRC2- and enhancer-marked regions, and its deletion is incompletely compensated by STAG1 (A) Genome-wide heatmaps of SA2, SA1, and SMC1A ChIP-seq peak centered signal in A673 cells expressing WT or KO STAG2. Regions are ranked based on WT signal. (B) Read density metaplots showing average RPKM (reads per kilobase per million)-normalized signal for SA2, SA1, and SMC1A in WT (black) and STAG2 KO (red) A673 cells. Differential read density in KO versus WT conditions. Unpaired t test with Welch's correction, ∗∗∗∗p < 0.0001; ns, not significant. (C) Clustered heatmaps of ChIP-seq peak centered signal for SA2, SA1, SMC1A, H3K27ac, H3K27me3, chromatin accessibility (ATAC-seq), and H3K4me3. Cluster regions are ranked by SA2 signal. (D) Hockey plots depicting motifs enriched in SA2/H3K27ac enhancers and SA2/H3K27me3 regions defined in (C). (E) Clustered heatmaps depicting SA2, SA1, and SMC1A signal in the cohesin regions defined in (C) in control and STAG2 KO A673 cells. (F) Metaplots showing average SA1 signal in the cohesin regions defined in (C). Differential read density in KO versus WT conditions. Unpaired t test with Welch's correction, ∗∗∗∗p < 0.0001, ∗∗p < 0.01. (G) Clustered heatmap depicting EWS/FLI1 signal in cohesin regions defined in (C) in control and STAG2 KO A673 cells. (H) Metaplot showing average EWS/FLI1 signal in cohesin regions defined in (C). Differential read density in KO versus WT. Unpaired t test with Welch's correction, ∗∗∗∗p < 0.0001, ∗∗p < 0.01. |
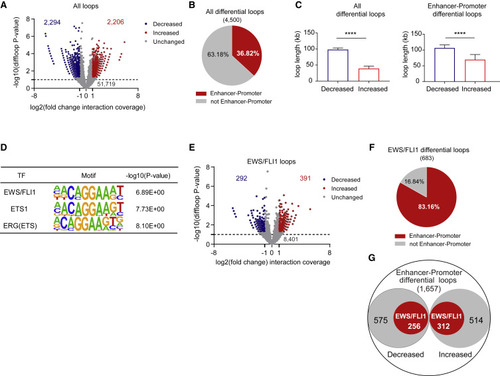
Loss of STAG2 alters the frequency of cis-chromatin contacts (A) Volcano plot of changes in chromatin loop strength comparing STAG2 WT with KO A673 cells based on SMC1A HiChIP. EdgeR overdispersed Poisson regression, |(FC)| ≥ 2, p ≤ 0.05. (B) Pie chart depicting the fraction of differential loops involving enhancer-promoter interactions. Two-tailed Fisher’s exact test, ∗∗∗∗p < 0.0001. (C) Median + 95% confidence interval plots for lengths of differential loops. Unpaired t test with Welch’s correction, ∗∗∗∗p < 0.0001. (D) Three of the top ten enriched motifs for the enhancer regions involved in differential enhancer-promoter loops. (E) Volcano plot depicting the differential status of the 9,084 EWS/FLI1 anchored differential loops. EdgeR overdispersed Poisson regression, |FC| ≥ 2, p ≤ 0.05. (F) Pie chart depicting the fraction of EWS/FLI1 anchored differential loops involving enhancer-promoter interactions. Two-tailed Fisher’s exact test, ∗∗∗∗p < 0.0001. (G) Diagram depicting the fraction of EWS/FLI1 anchored enhancer-promoter interactions as a subset of all differential enhancer-promoter loops. Two-tailed Fisher’s exact test, ∗∗∗∗p < 0.0001. |
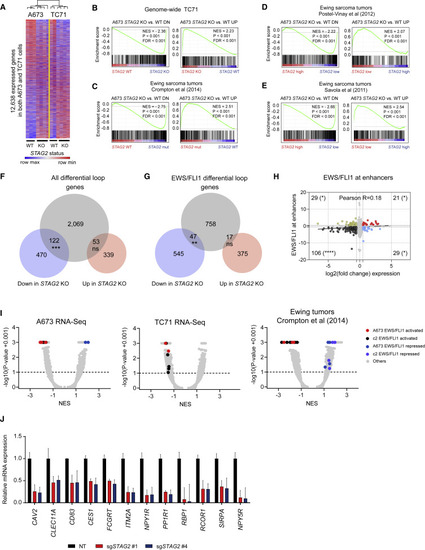
Loss of STAG2 alters the EWS/FLI1-driven oncogenic transcriptional program (A) Heatmap and average linkage dendrogram of genome-wide gene expression, log2(normalized counts), in STAG2 KO versus WT A673 and TC71 cells. (B–E) GSEA plots demonstrating the enrichment of the STAG2 KO versus WT gene signature for A673 cells in the genome-wide expression changes induced by STAG2 KO in (B) TC71 cells or (C–E) three distinct Ewing sarcoma primary patient tumor datasets. Normalized enrichment score, p value, and false discovery rate (FDR) are indicated in each plot. (F) Venn diagram depicting the overlap between differentially expressed genes with genes harboring a differential loop within 5 kb of their TSS. Two-tailed Fisher’s exact test, ∗∗∗p < 0.001; ns, not significant. (G) Similar analysis as in (F) is shown for EWS/FLI1 anchored differential loops. Two-tailed Fisher’s exact test, ∗∗p < 0.01; ns, not significant. (H) Scatterplot depicting the overlap between gene expression change and EWS/FLI1 binding at the nearest enhancer assessed by ChIP-seq. Two-tailed Fisher’s exact test, ∗∗∗∗p < 0.0001, ∗p < 0.05. (I) Volcano plots for GSEA enrichment scores for the genome-wide expression changes induced in A673 and TC71 and by STAG2 mutant versus STAG2 WT tumor samples from Crompton et al. (2014) versus the union of a collection of 12 EWS/FLI1 public gene signatures in A673 cells and MSigDB v7.1 c2 pathways (5,529 gene sets). (J) qRT-PCR-based validation of a subset of EWS/FLI1 target genes repressed in STAG2 KO relative to control A673 cells. Data shown as mean ± SD. |
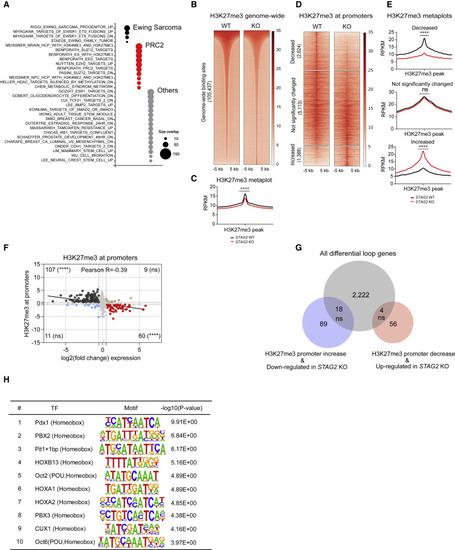
Loss of STAG2 perturbs PRC2-mediated regulation of gene expression (A) Bubble plot summarizing top significant enrichments (size overlap ≥25, p ≤ 0.05, FDR ≤ 0.05) for the MSigDB v7.1 c2 collection. Enriched gene sets are clustered in representative functional categories. (B) Genome-wide heatmaps of H3K27me3 ChIP-seq signal in A673 cells expressing WT or STAG2 KO centered on significant peaks identified in either or both conditions. (C) Metaplots showing average genome-wide H3K27me3 signal in STAG2 KO and WT A673 cells. Unpaired t test with Welch's correction, ∗∗∗∗p < 0.0001. (D) Clustered heatmaps depicting TSS ± 5-kb promoter regions with decreased, not significantly changed, or increased H3K27me3 ChIP-seq binding in STAG2 KO versus WT A673 cells (|Delta(area under curve signal)| ≥ 1.5). (E) Metaplots showing average H3K27me3 signal in the promoter regions defined in (C). Differential read density for STAG2 KO versus WT A673 within clusters. Unpaired t test with Welch's correction, ∗∗∗∗p < 0.0001; ns, not significant. (F) Scatterplot depicting the overlap between the genes with significant change for H3K27me3 ChIP-seq binding at promoter regions with differentially expressed genes. Two-tailed Fisher’s exact test, ∗∗∗∗p < 0.0001; ns, not significant. (G) Venn diagram showing the overlap between the subset of genes with concurrent changes in expression and H3K27me3 levels at the promoter (shown in F) with the total list of genes harboring a differential loop within 5 kb of the TSS. Two-tailed Fisher’s exact test; ns, not significant. (H) List of top ten enriched motifs at the promoters of genes with altered H3K27me3 levels in STAG2 KO cells. |
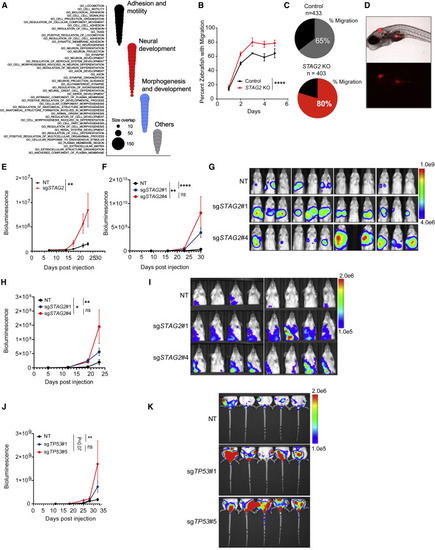
Depletion of STAG2 enhances the migration and metastatic potential of Ewing sarcoma cells (A) Bubble plot summarizing top 50 significant enrichments (size overlap ≥10, p ≤ 0.05, FDR ≤ 0.05) for the MSigDB v7.1 c5 collection. Enriched gene sets are clustered in representative functional categories. (B) Line graph represents mean ± SD of the percentage of zebrafish that displayed migration to at least one of the three regions of interest as a function of the days post injection. Two-way ANOVA, ∗∗∗∗p < 0.0001. (C) Pie chart showing the percentage of zebrafish with migration of Ewing cells to at least one of the three sites examined 3 days post injection. (D) Representative bright-field (top) and fluorescence (541/565 nm bottom) images displaying migration of TC71 cells to the yolk sac. (E) Quantification of bioluminescence signal collected for lower extremities after blocking upper abdominal cavity. Line graph represents mean ± SEM, n = 8 per group. Two-way ANOVA, ∗∗p < 0.001. (F) Quantification of bioluminescence signal collected for upper thoracic cavity after blocking lower abdomen. Line graph represents mean ± SEM, n = 12 per group. Two-way ANOVA, ∗∗∗∗p < 0.0001,∗∗p < 0.01; ns, not significant. (G) Bioluminescence images of mice described in (F). (H) Quantification of bioluminescence signal collected for upper thoracic cavity while blocking lower abdomen. Line graph represents mean ± SEM, n = 8 per group. Two-way ANOVA, ∗∗∗∗p 0.0001,∗∗p < 0.01; ns, not significant. (I) Bioluminescence images of mice described in (H). (J) Quantification of bioluminescence signal collected for lower extremities after blocking upper abdominal cavity. Line graph represents mean ± SEM, n = 5 per group. Two-way ANOVA, ∗∗p < 0.01; ns, not significant. (K) Bioluminescence images of mice described in (J). |
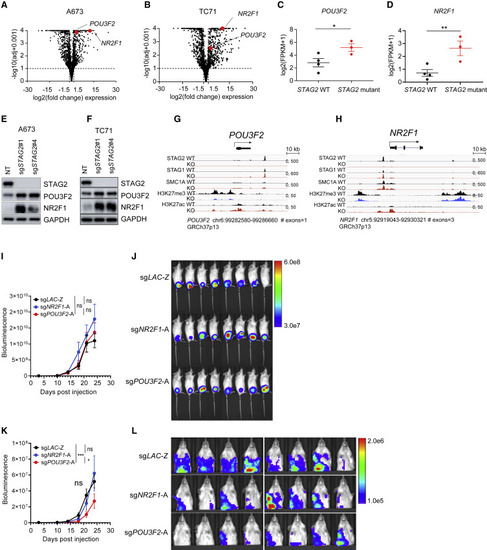
The neurodevelopmental transcription factor POU3F2 modulates the metastatic potential of STAG2 KO Ewing sarcoma cells (A and B) Volcano plot depicting the transcriptional changes induced by STAG2 KO versus control in (A) A673 and (B) TC71 cells. POU3F2 and NR2F1 are highlighted in red. Significance cutoffs: |log2(FC)| ≥ 1.5, adjusted p ≤ 0.10. (C and D) Scatter dot plot depicting the mean ± SEM mRNA log2(FPKM [fragments per kilobase per million] + 1) expression of (C) POU3F2 and (D) NR2F1 in three STAG2 mutant tumors versus the top four STAG2 WT tumors with highest STAG2 expression from Crompton et al. (2014) data. Mann-Whitney non-parametric t test, ∗∗p < 0.001, ∗p < 0.05. (E and F) Validation of an increase in POU3F2 and NR2F1 protein levels in (E) A673 and (F) TC71 cells clonally selected for STAG2 loss. (G and H) Integrated genomics viewer track showing SA2, SA1, SMC1, H3K27me3, and H3K27ac signals at the (G) POU3F2 and (H) NR2F1 locus in control and STAG2 KO A673 cells. (I) Quantification of bioluminescence signal for whole body. Line graph represents mean ± SEM, n = 8 per group. Two-way ANOVA; ns, not significant. (J) Bioluminescence images of mice described in (I). (K) Quantification of bioluminescence signal for upper thoracic cavity after blocking the primary tumor at the lower abdomen. Line graph represents mean ± SEM, n = 8 per group. Two-way ANOVA, ∗∗∗p < 0.001, ∗p < 0.05; ns, not significant. (L) Bioluminescence images of mice described in (K). |
Reprinted from Cancer Cell, 39, Adane, B., Alexe, G., Seong, B.K.A., Lu, D., Hwang, E.E., Hnisz, D., Lareau, C.A., Ross, L., Lin, S., Dela Cruz, F.S., Richardson, M., Weintraub, A.S., Wang, S., Iniguez, A.B., Dharia, N.V., Conway, A.S., Robichaud, A.L., Tanenbaum, B., Krill-Burger, J.M., Vazquez, F., Schenone, M., Berman, J.N., Kung, A.L., Carr, S.A., Aryee, M.J., Young, R.A., Crompton, B.D., Stegmaier, K., STAG2 loss rewires oncogenic and developmental programs to promote metastasis in Ewing sarcoma, 827-844.e10, Copyright (2021) with permission from Elsevier. Full text @ Cancer Cell