
Fig. 6
- ID
- ZDB-FIG-230120-7
- Publication
- Adane et al., 2021 - STAG2 loss rewires oncogenic and developmental programs to promote metastasis in Ewing sarcoma
- Other Figures
- All Figure Page
- Back to All Figure Page
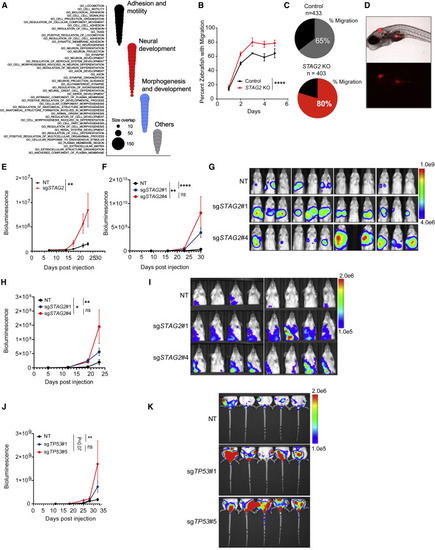
Depletion of STAG2 enhances the migration and metastatic potential of Ewing sarcoma cells (A) Bubble plot summarizing top 50 significant enrichments (size overlap ≥10, p ≤ 0.05, FDR ≤ 0.05) for the MSigDB v7.1 c5 collection. Enriched gene sets are clustered in representative functional categories. (B) Line graph represents mean ± SD of the percentage of zebrafish that displayed migration to at least one of the three regions of interest as a function of the days post injection. Two-way ANOVA, ∗∗∗∗p < 0.0001. (C) Pie chart showing the percentage of zebrafish with migration of Ewing cells to at least one of the three sites examined 3 days post injection. (D) Representative bright-field (top) and fluorescence (541/565 nm bottom) images displaying migration of TC71 cells to the yolk sac. (E) Quantification of bioluminescence signal collected for lower extremities after blocking upper abdominal cavity. Line graph represents mean ± SEM, n = 8 per group. Two-way ANOVA, ∗∗p < 0.001. (F) Quantification of bioluminescence signal collected for upper thoracic cavity after blocking lower abdomen. Line graph represents mean ± SEM, n = 12 per group. Two-way ANOVA, ∗∗∗∗p < 0.0001,∗∗p < 0.01; ns, not significant. (G) Bioluminescence images of mice described in (F). (H) Quantification of bioluminescence signal collected for upper thoracic cavity while blocking lower abdomen. Line graph represents mean ± SEM, n = 8 per group. Two-way ANOVA, ∗∗∗∗p 0.0001,∗∗p < 0.01; ns, not significant. (I) Bioluminescence images of mice described in (H). (J) Quantification of bioluminescence signal collected for lower extremities after blocking upper abdominal cavity. Line graph represents mean ± SEM, n = 5 per group. Two-way ANOVA, ∗∗p < 0.01; ns, not significant. (K) Bioluminescence images of mice described in (J). |
Reprinted from Cancer Cell, 39, Adane, B., Alexe, G., Seong, B.K.A., Lu, D., Hwang, E.E., Hnisz, D., Lareau, C.A., Ross, L., Lin, S., Dela Cruz, F.S., Richardson, M., Weintraub, A.S., Wang, S., Iniguez, A.B., Dharia, N.V., Conway, A.S., Robichaud, A.L., Tanenbaum, B., Krill-Burger, J.M., Vazquez, F., Schenone, M., Berman, J.N., Kung, A.L., Carr, S.A., Aryee, M.J., Young, R.A., Crompton, B.D., Stegmaier, K., STAG2 loss rewires oncogenic and developmental programs to promote metastasis in Ewing sarcoma, 827-844.e10, Copyright (2021) with permission from Elsevier. Full text @ Cancer Cell