
- Title
-
Multi-omics analyses of early liver injury reveals cell-type-specific transcriptional and epigenomic shift
- Authors
- Migdał, M., Tralle, E., Nahia, K.A., Bugajski, Ł., Kędzierska, K.Z., Garbicz, F., Piwocka, K., Winata, C.L., Pawlak, M.
- Source
- Full text @ BMC Genomics
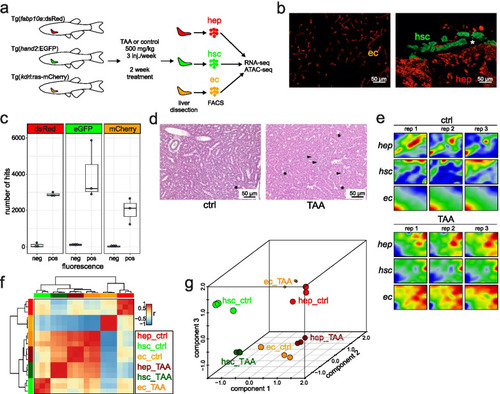
Transcriptional portraits of liver cells in response to TAA. a A scheme of the study. Adult transgenic zebrafish lines were treated with TAA (500 mg/kg) or control (saline) three times per week for 2 weeks. Livers were removed and fluorescent-positive cells were sorted by FACS. RNA-seq and ATAC-seq libraries were performed from sorted cells; b Transgenic zebrafish liver cryosection micrographs visualizing ECs (Tg(kdrl:Hsa.HRAS-mCherry)), HSCs (TgBAC(hand2:EGFP)) and HEPs (Tg(fabp10a:dsRed)) as indicated on the figure legends; c Number of transgene BLAST hits from fluorescent-negative and positive cells from transgenic zebrafish lines; d Microscopic images of histological H&E sections of control and TAA-treated animals indicating inflammation loci (arrowheads) and extracellular lipid droplets (asterisks); e Portraits of co-regulated over- or underexpressed metagenes as red and blue spots, respectively. The color gradient of the map visualizes over- and underexpression of the metagenes compared with the mean expression level in the pool of all samples studied; f Sample pairwise Pearson correlation heatmap on the clustered data; g Independent Component Analysis on clustered data |
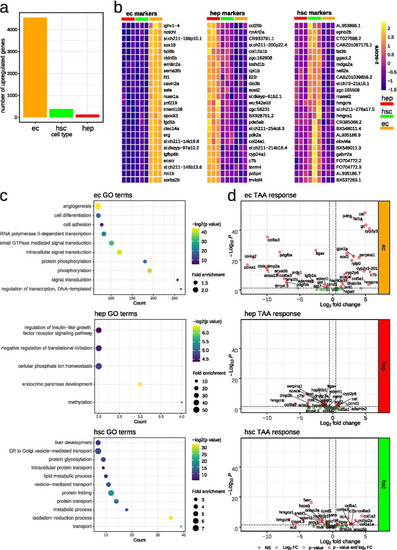
Liver cell signatures in quiescent and activated state. a Number of identified cell type specific genes at quiescent state in each cell type, logFC > 0, padj < 0.05; b Heatmaps of top 25 cell type specific genes at quiescent state in each cell type, logFC > 0, padj < 0.05; c GO over-representation analysis of identified cell type specific genes at quiescent state in each cell type; d Volcano plot of selected genes, involved in liver fibrosis and response to oxidative stress, under TAA treatment |
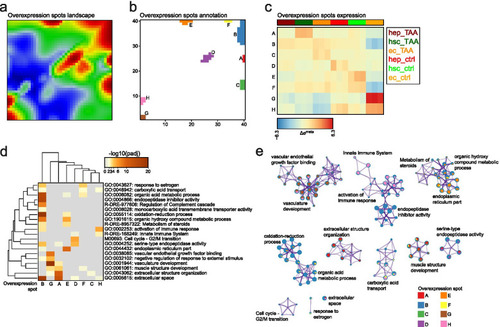
Functional characterization of overexpression spots landscape. a Overexpression spots landscape. Logged expression values of each gene were transformed into differential expression values relative to the mean expression of the particular gene in the experimental series of samples considered. Overexpression spots are coloured in red; b Overexpression spots annotation to clusters from A to H; c Mean overexpression spots expression across samples; d Gene sets enrichment analysis on the clustered data. Overrepresentation p-values for each cluster are provided; e Meta-analysis of gene set enrichment performed by Metascape. Only significantly enriched terms are shown (padj < 0.05) |
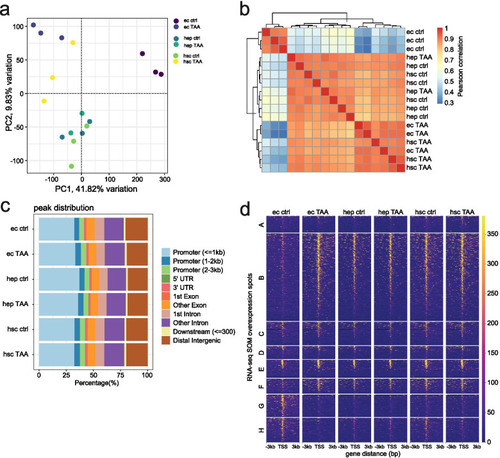
Chromatin accessibility maps of liver cells. a Principal component analysis of ATAC-seq peaks across cell types and conditions; b Sample pairwise Pearson correlation heatmap of chromatin accessibility in ATAC-seq peaks across cell types and conditions; c ATAC-seq peak distribution across genomic categories; d Coverage heatmaps of ATAC-seq peaks localized in the promoters (− 3 to + 3 kb from TSS) of SOM clusters |
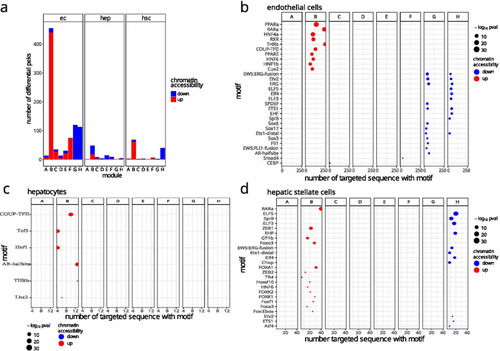
TF motif enrichment in response to pro-fibrotic stimuli. a Metrics of differential promoter peaks (− 3 to + 3 kb from TSS) in SOM clusters; b Homer motif enrichment analysis in ECs differential peaks; c Homer motif enrichment analysis in HEPs differential peaks; d Homer motif enrichment analysis in HSCs differential peaks. Only enriched motifs with p-adjusted < 0.1 are shown |
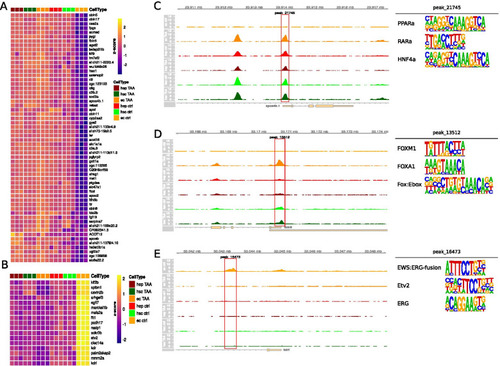
Cell type specific accessibility changes in response to TAA treatment in selected cell types and clusters. a Heatmap of selected genes in each cell type. Genes were selected based on accessibility patterns in cluster B; b Heatmap of selected genes in each cell type. Genes were selected based on accessibility patterns in cluster B; c Genomic browser snapshot at apoa4b.1 promoter localization with accessibility track expressed as reads per million. Highlighted peak was used as a selection criteria in a., its three most enriched motifs are shown next to the browser track; d Genomic browser snapshot at fbln5 promoter localization with accessibility track expressed as reads per million. Highlighted peak was used as a selection criteria in a., its three most enriched motifs are shown next to the browser track; e Genomic browser snapshot at kdrl promoter localization with accessibility track expressed as reads per million. Highlighted peak was used as a selection criteria in b., its three most enriched motifs are shown next to the browser track |