
|
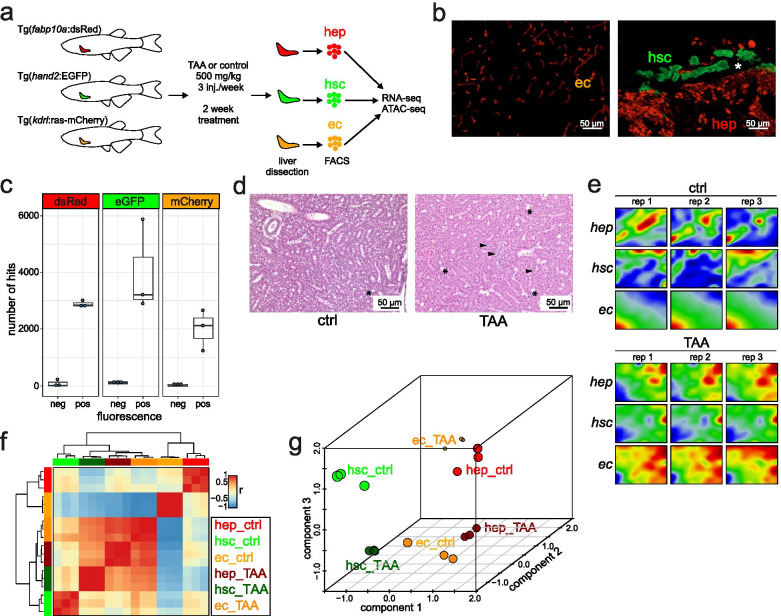
Fig. 1 Transcriptional portraits of liver cells in response to TAA. a A scheme of the study. Adult transgenic zebrafish lines were treated with TAA (500 mg/kg) or control (saline) three times per week for 2 weeks. Livers were removed and fluorescent-positive cells were sorted by FACS. RNA-seq and ATAC-seq libraries were performed from sorted cells; b Transgenic zebrafish liver cryosection micrographs visualizing ECs (Tg(kdrl:Hsa.HRAS-mCherry)), HSCs (TgBAC(hand2:EGFP)) and HEPs (Tg(fabp10a:dsRed)) as indicated on the figure legends; c Number of transgene BLAST hits from fluorescent-negative and positive cells from transgenic zebrafish lines; d Microscopic images of histological H&E sections of control and TAA-treated animals indicating inflammation loci (arrowheads) and extracellular lipid droplets (asterisks); e Portraits of co-regulated over- or underexpressed metagenes as red and blue spots, respectively. The color gradient of the map visualizes over- and underexpression of the metagenes compared with the mean expression level in the pool of all samples studied; f Sample pairwise Pearson correlation heatmap on the clustered data; g Independent Component Analysis on clustered data