
Fig. 3
- ID
- ZDB-FIG-211224-35
- Publication
- Migdał et al., 2021 - Multi-omics analyses of early liver injury reveals cell-type-specific transcriptional and epigenomic shift
- Other Figures
- All Figure Page
- Back to All Figure Page
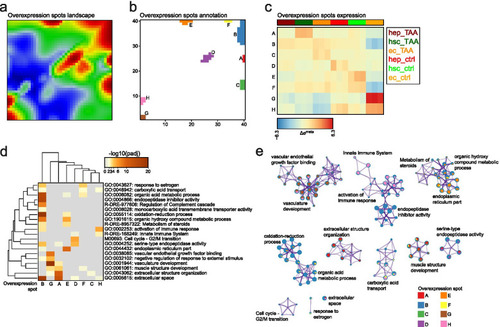
Functional characterization of overexpression spots landscape. a Overexpression spots landscape. Logged expression values of each gene were transformed into differential expression values relative to the mean expression of the particular gene in the experimental series of samples considered. Overexpression spots are coloured in red; b Overexpression spots annotation to clusters from A to H; c Mean overexpression spots expression across samples; d Gene sets enrichment analysis on the clustered data. Overrepresentation p-values for each cluster are provided; e Meta-analysis of gene set enrichment performed by Metascape. Only significantly enriched terms are shown (padj < 0.05) |