
Image
|
Figure Caption
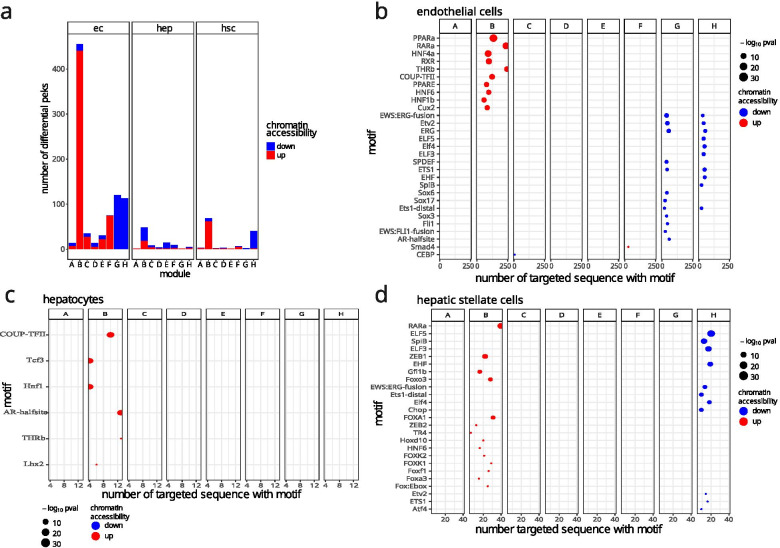
Fig. 5 TF motif enrichment in response to pro-fibrotic stimuli. a Metrics of differential promoter peaks (− 3 to + 3 kb from TSS) in SOM clusters; b Homer motif enrichment analysis in ECs differential peaks; c Homer motif enrichment analysis in HEPs differential peaks; d Homer motif enrichment analysis in HSCs differential peaks. Only enriched motifs with p-adjusted < 0.1 are shown
Acknowledgments
This image is the copyrighted work of the attributed author or publisher, and
ZFIN has permission only to display this image to its users.
Additional permissions should be obtained from the applicable author or publisher of the image.
Full text @ BMC Genomics