
- Title
-
A permissive epigenetic landscape facilitates distinct transcriptional signatures of activating transcription factor 6 in the liver
- Authors
- Nair, A.R., Lakhiani, P., Zhang, C., Macchi, F., Sadler, K.C.
- Source
- Full text @ Genomics

CPATs identification, validation and functional investigation strategy (A) Sequence alignment of promoter regions (200 bp upstream of TSS) of hspa5 and herpud1from human, mouse and zebrafish genomes. Highlighted regions indicate ERSE I in green, Atf6 RE in pink and TATA in red. (B) Strategy for identification of CPATs included an exact match to: (i) the first half of the ERSE I and II consensus sequence required for NFY binding (CCAAT/ATTGG), (ii) the second half of the ERSE I and II shown to have Atf6 binding activity (CCACG) and (iii) the Atf6 RE shown to have Atf6 binding activity (TGACGTG). Sequences pertaining to each criteria was identified in the proximal promoters (acquired from BioMart, designated as −500 bp from the TSS) of orthologous genes in zebrafish, mouse, and human. All genes were converted to the zebrafish ortholog and Venn diagram indicates the zebrafish genes that overlap between each criteria. Cumulative set of genes either having a complete ERSEI/II site (635 genes), the Atf6 RE (15 genes) or both (2) were designated as constitutive putative Atf6 target genes or CPATS (=652 genes). Canonical Atf6 target genes are indicated. (C) CPATs were validated against other in-silico methods of finding transcription factor targets such as public databases (tftargets and Harmonize), ENCODE for tagged ATF6-genome occupancy in human cells and functional datasets in human cells and mouse livers. Finally, CPATs were assessed in different functional contexts known for Atf6 activity in zebrafish and mouse livers generated in our group: stress-independent nAtf6 overexpression; exposure toxicants (EtOH or iAs) and physiological stress during mouse liver regeneration after partial hepatectomy (PH). (For interpretation of the references to colour in this figure legend, the reader is referred to the web version of this article.) |
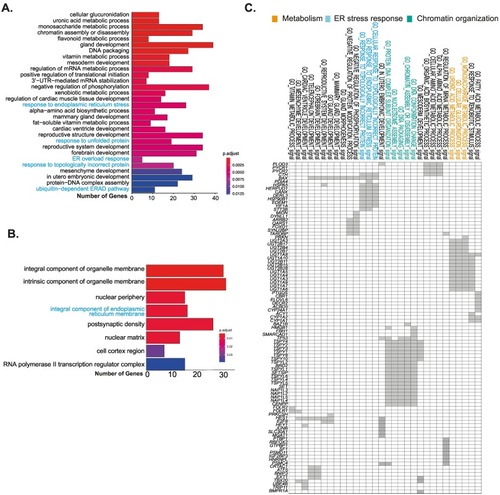
CPATs are involved in proteostasis, small molecule metabolism and development (A) Gene Ontology (GO) based biological process enrichment analysis of top 25 terms in putative Atf6 targets; terms related to proteostasis highlighted in blue (B) GO cellular component analysis: terms related to ER highlighted in blue. (C) Geneset enrichment Leading Edge analysis highlights the groups of genes driving a particular function. Grey boxes mark the genes representing each GO term. Highlighted in blue are proteostasis, orange are small molecule metabolism and green are DNA packing related GO terms. (For interpretation of the references to colour in this figure legend, the reader is referred to the web version of this article.) |
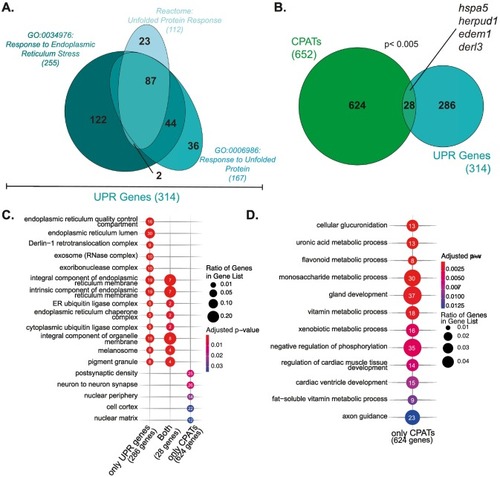
A minority of CPATs are involved in proteostasis (A) Venn diagram depicting overlap of UPR Genes annotated to REACT_18356, GO :0034976, and GO:0006986 in humans obtained from Reactome and AmiGO respectively. (B) Human UPR genes were converted to zebrafish homologs (turquoise) for integration with CPATs (green) with bona fide CPATs shown in black. Significant enrichment of CPATs in UPR gene dataset was determined by Fisher's exact test. (C) & (D) Gene ontology-based cellular component or biological process overrepresentation analysis of overlapping and non-overlapping CPATs and UPR genes and of CPATs that are not UPR targets; terms related to proteostasis are blue. Statistically significant results are plotted with point size depicting fraction of genes in each gene list annotated to each GO term; point numbers showing the exact number of genes annotated. (For interpretation of the references to colour in this figure legend, the reader is referred to the web version of this article.) |
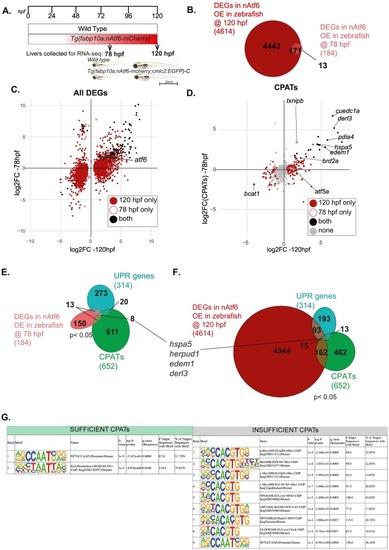
Stress-independent nAtf6 overexpression activates a small subset of CPATs and UPR genes Experimental set up of RNA-seq liver collections at 78 hpf and 120 hpf wild type zebrafish larvae and Tg(fabp10a:nAtf6-mcherry;cmlc2:GFP)-C transgenics used in these studies. Representative images of wild type zebrafish larvae and Tg(fabp10a:nAtf6-mcherry;cmlc2:GFP)-C transgenics at 78 hpf and 120 hpf. (B) Venn diagram depicting the overlap between genes significantly differentially expressed (p < 0.05) in nAtf6 over expressing zebrafish livers at 78 hpf (pink) and 120 hpf (dark red). (C) Cross plot showing the DEGS unique to 120 hpf (dark red), unique to 78 hpf (pink empty circle) and those that are differentially expressed in both samples (black). Atf6 indicated by black circle with green circle. (D) Cross plot showing CPATs unique to 120 hpf (dark red), unique to 78 hpf (pink empty circle) and those that are differentially expressed in both (black). Grey indicates CPATs that do not change. (E-F) Venn diagram depicting overlap of CPATs (green), UPR genes (turquoise), and DEGS in nAtf6 at (E) 78 hpf (pink) and (F) 120 hpf (dark red). (G) Known Motifs identified using HOMER within −500 bp from TSS of CPATs segregated as Sufficient and Insufficient. Showing only motifs with q-value<0.01. (For interpretation of the references to colour in this figure legend, the reader is referred to the web version of this article.) |

Fig. 5. Stress-free nAtf6 expression and toxicant-induced stress regulate distinct transcriptional signatures in the liver (A) EtOH exposure scheme showing zebrafish larvae exposed from 96 to 120 hpf with 350 mM EtOH and the livers were dissected and processed for RNAseq at 120 hpf (B) Venn diagram depicting the overlap between significantly DEGs in EtOH conditions (yellow), CPATs (green) and UPR genes (turquoise). (C) Protocol for zebrafish larvae exposed to 1 mM iAs from 96 to 120 hpf. (D) Venn diagram depicting the overlap between significantly DEGs in iAs conditions (violet), Atf6 targets (green) and UPR genes (turquoise). (E) Venn diagram depicting the overlap of CPATs differentially expressed in EtOH (yellow), iAs (violet) and sufficient CPATs defined in Fig. 3 (red). (F) Heatmap showing unsupervised clustering of the 34 common CPATs. (For interpretation of the references to colour in this figure legend, the reader is referred to the web version of this article.) |
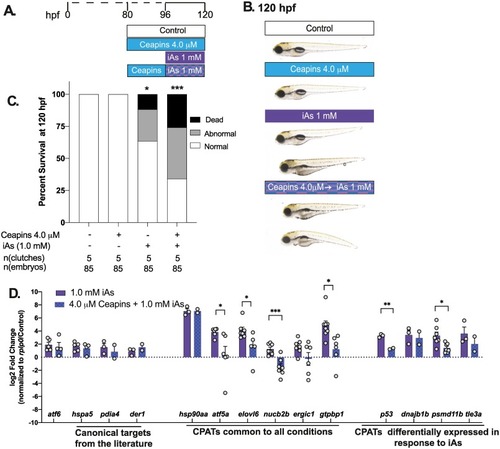
Fig. 6. Atf6 inhibition by Ceapins A7 suppresses CPAT expression during acute iAs exposure (A) Exposure scheme showing zebrafish larvae were pre-treated with 4.0 uM Ceapins from 80 hpf and then co-exposed to 1 mM iAs and Ceapins from 96 to 120 hpf. (B) Representative images of 120 hpf zebrafish larvae subjected to treatments in (A). Arrow highlights the phenotypes such as spinal curvature, edema, distended gut and brain necrosis (darkening of the head) compared to controls. (C) Percent of normal, abnormal and dead zebrafish at 120 hpf per treatment condition; n = 85, 5 clutches; *** p < 0.0005, *p < 0.05, by two-way ANOVA. (D) Gene expression analysis by qPCR depicting log2 of the fold change (L2FC) of select genes categorized as canonical Atf6 targets in other studies, CPATs that were commonly DE in all three conditions and CPATs that were uniquely DE in iAs. (**** p < 0.00005, **p < 0.005, *p < 0.05, by unpaired t-test) |