
Fig. 4
- ID
- ZDB-FIG-230209-1
- Publication
- Nair et al., 2021 - A permissive epigenetic landscape facilitates distinct transcriptional signatures of activating transcription factor 6 in the liver
- Other Figures
- All Figure Page
- Back to All Figure Page
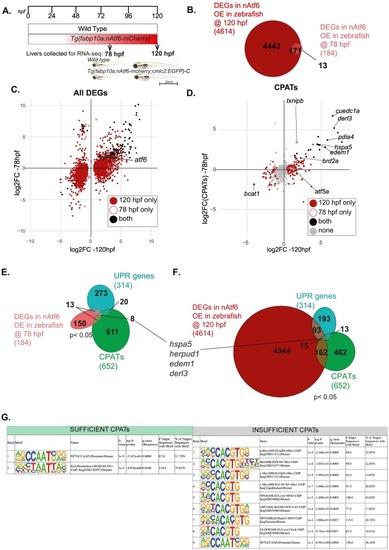
Stress-independent nAtf6 overexpression activates a small subset of CPATs and UPR genes Experimental set up of RNA-seq liver collections at 78 hpf and 120 hpf wild type zebrafish larvae and Tg(fabp10a:nAtf6-mcherry;cmlc2:GFP)-C transgenics used in these studies. Representative images of wild type zebrafish larvae and Tg(fabp10a:nAtf6-mcherry;cmlc2:GFP)-C transgenics at 78 hpf and 120 hpf. (B) Venn diagram depicting the overlap between genes significantly differentially expressed (p < 0.05) in nAtf6 over expressing zebrafish livers at 78 hpf (pink) and 120 hpf (dark red). (C) Cross plot showing the DEGS unique to 120 hpf (dark red), unique to 78 hpf (pink empty circle) and those that are differentially expressed in both samples (black). Atf6 indicated by black circle with green circle. (D) Cross plot showing CPATs unique to 120 hpf (dark red), unique to 78 hpf (pink empty circle) and those that are differentially expressed in both (black). Grey indicates CPATs that do not change. (E-F) Venn diagram depicting overlap of CPATs (green), UPR genes (turquoise), and DEGS in nAtf6 at (E) 78 hpf (pink) and (F) 120 hpf (dark red). (G) Known Motifs identified using HOMER within −500 bp from TSS of CPATs segregated as Sufficient and Insufficient. Showing only motifs with q-value<0.01. (For interpretation of the references to colour in this figure legend, the reader is referred to the web version of this article.) |